
Over the past 12 years, there has been a dramatic increase in Medicaid enrollment and expenditures in New York City; increases that mirror growth in the program for New York State as a whole. But the city is not solely responsible for the statewide growth. With differences in the population mix and other variables in different regions of the state, the factors behind Medicaid growth in the state are more complex.
Medicaid enrollment has shot up 83.3 percent across the state, increasing from an average of 2.7 million individuals per month in 2000 to nearly 5 million in 2012.1 Local, state, and federal expenditures on Medicaid services have nearly doubled, from a total of $22.7 billion in 2000 to $44.5 billion in 2012.2 Adjusted for inflation, Medicaid spending statewide increased by 25.2 percent, or $9.0 billion in 2012 dollars.3
In the wake of this extensive program growth, IBO has taken a close look at trends in the Medicaid caseload in different parts of New York State for different population groups. This fiscal brief uses 12 years’ worth of Medicaid enrollment and expenditure data from the New York State Department of Health. (These data include Family Health Plus, as it is administered as part of the state’s Medicaid program. They do not, however, include Child Health Plus, which is New York State’s version of the Children’s Health Insurance Program and is administered separately from Medicaid.) Specifically, IBO’s analysis focused on changes in the aggregate numbers of children, adults, seniors, and disabled enrollees in Medicaid and their associated costs over time. (For the purposes of Medicaid eligibility, a child is defined as someone age 18 or younger and a senior or "aged" enrollee is defined as someone age 65 or older.) IBO has also parsed the state’s data into three broad geographic regions in order to compare enrollment trends in New York City with those in the rest of the state. As defined here, the New York City region includes the five counties in the city; the downstate suburban region includes Nassau, Putnam, Rockland, Suffolk, and Westchester counties; and the upstate region includes all other New York State counties.
This fiscal brief examines whether certain regions and populations have been driving more of New York State’s Medicaid growth than others. It also considers whether there are differences in the composition of the Medicaid caseload in New York City versus elsewhere in the state. Understanding such differences will be critically important for the city and the state as several major changes to New York State’s Medicaid program are phased in over the coming years, including an expansion of eligibility under the federal Affordable Care Act (ACA) in 2014.
Background
Medicaid was created by Congress through the Social Security Act Amendments of 1965 to provide health insurance to low-income Americans. States that opt into the federal program—currently all 50—administer Medicaid within their borders and receive federal matching funds, typically in the range of 50 percent to 75 percent of total expenditures, in exchange for following certain requirements. One such requirement is that states may impose only a minimal cost-sharing burden on program enrollees. Another is that Medicaid coverage be made available to children, pregnant women, parents, seniors, and the disabled who meet federally established minimum eligibility criteria. These criteria vary by eligibility category, but are generally based on family income in relation to the federal poverty level (FPL), asset levels, and/or eligibility for other federal programs such as Supplemental Security Income. Individual states seeking to establish more inclusive eligibility criteria for the mandatory coverage groups or to provide Medicaid to optional coverage groups, such as childless adults, must obtain federal approval in order to receive federal matching funds.
In New York State, Medicaid was established in 1966 and health insurance coverage is provided either on a fee-for-service basis or, increasingly, through private managed care companies. It is distinct from other Medicaid programs throughout the country for several reasons. New York has adopted more generous eligibility thresholds than many other states, particularly for childless adults, and has created a number of add-on programs targeted to specific populations. In part due to this, New York’s Medicaid program is one of the most expensive in the country.4
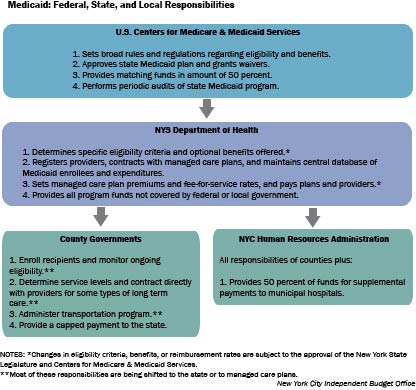
As is the case throughout the country, the federal government agency in charge of Medicaid—the U.S. Centers for Medicare and Medicaid Services, or CMS—is responsible for broad oversight of New York State’s Medicaid program. While adhering to federal guidelines, the New York State Legislature and Department of Health (state DOH) determine specific program policies, and state DOH handles many of the administrative tasks of running the program. In an arrangement that is somewhat unusual and is now being phased out, local New York State government bodies—county governments outside the city and the Human Resources Administration (HRA) within the city—also have considerable administrative responsibilities. (See flow chart on next page for more details.) In addition, New York requires local governments, including New York City and counties across the state, to be responsible for a significant financial contribution to the state’s Medicaid program. While this type of requirement is not unique to New York, the size of the commitment is larger here than in any other state.
Recent and Upcoming Changes to New York’s Medicaid Program. While Medicaid represents a large share of New York City’s and New York state counties’ budgets, legislative changes at the state level over the past seven years have limited increases in local costs. More recently and in part due to provisions in the Affordable Care Act, the state has begun moving forward with a plan to phase down localities’ administrative responsibilities. Statewide, the ACA also promises to both bring about an increase in the size of the Medicaid-eligible population and introduce new incentives for those already eligible to sign up for coverage.
The local-level financial contribution to Medicaid has been significantly altered in recent years. Historically, the counties and New York City were required to pay a fixed share of the costs associated with providing Medicaid services to their residents. In 2006, legislation took effect capping most local costs at calendar year 2005 levels plus a yearly inflation adjustment, with all nonfederal costs above the cap amount picked up by the state. More recently, the state’s fiscal year 2012-2013 budget included a plan to phase out the inflation adjustment completely by calendar year 2015, thereby freezing each locality’s Medicaid spending at its 2014 level.
These two pieces of legislation have significantly reduced New York City’s Medicaid obligations below what they would have been under the old financing formula; nevertheless Medicaid remains a substantial fiscal commitment. In addition to its cap payment and some other minor expenditures, the city contributes 50 percent of the cost of supplemental Medicaid payments to New York City’s municipal hospital system.5 Overall, New York City’s total Medicaid payments are projected to total $6.3 billion in 2014, or roughly 12.5 percent of the city-funded portion of the budget.
Another area where there have been recent changes to New York State’s Medicaid program is localities’ administrative responsibilities. In addition to the fiscal changes described above, the state’s 2012-2013 budget also included a plan to transfer responsibility for Medicaid administration from HRA and the counties to state DOH in phases, with the shift to be completed by March 31, 2018. When the transition is complete, state DOH will be responsible for processing all new Medicaid enrollments and renewals and overseeing all nonemergency transportation programs. Moreover, managed care plans rather than localities will be responsible for authorizing appropriate services and service levels for all enrollees in long-term care. Some aspects of this transition are already underway, while others have yet to commence.
One impetus for these administrative changes is the recent and pending implementation of several major pieces of the Affordable Care Act in 2014. The first and most relevant of these is the requirement that states determine eligibility for both federally supported premium subsidies and Medicaid coverage through their new health insurance exchange. In the case of New York State, this means the transition to a digitized, online enrollment process and the centralization of Medicaid enrollment responsibilities.
In addition to changing how the Medicaid program is administered, the ACA will also expand the pool of individuals eligible for Medicaid, largely by extending coverage to both parents and childless adults up to 138 percent of FPL. Under the Supreme Court’s decision in National Federation of Independent Business v. Sebelius, this coverage expansion cannot be made compulsory and the decision on whether to adopt it is being hotly debated in several states. New York State is moving forward with the changes however, in part because the new federal income thresholds are fairly close to ones the state voluntarily adopted years ago. Specifically, the Medicaid expansion under ACA will only require the state to increase the income limits from 100 percent to 138 percent of FPL for childless adults and to shift some children and adults from Child Health Plus or Family Health Plus into traditional Medicaid. At least through 2015, Child Health Plus will continue to enroll children whose family incomes fall within the current income threshold for that program (up to 400 percent of FPL), but above the new Medicaid threshold (138 percent of FPL).6 In contrast, Family Health Plus, which serves childless adults with incomes of up to 100 percent of FPL and parents with incomes of up to 150 percent of FPL, is being phased out as a distinct program starting in January 2014. The small group of individuals eligible for Family Health Plus in its current form but ineligible for the expanded Medicaid program (parents with income from 139 percent to 150 percent of FPL) will be shifted into the new insurance exchanges and offered an additional subsidy to cover premium costs.
Thus, the expected change in the number of Medicaid eligible individuals in New York State is quite small—around 100,000 people or 2 percent of current enrollment according to the United Hospital Fund.7 Any increase in the take-up rate that ACA inspires among already eligible individuals may ultimately be a much more significant issue in New York. In this context, determining who is currently enrolling in Medicaid and why becomes critically important.
Enrollment Growth, 2000–2012
Over the past 12 years, enrollment in New York State’s Medicaid program has nearly doubled, climbing from 2.7 million individuals in 2000 to just under 5 million in 2012. This dramatic enrollment growth can be traced back to a number of policy initiatives and changes in the local economy, including several expansion programs, reforms aimed at simplifying the enrollment and renewal process, and two recessions. These changes, however, have not affected all eligibility groups and regions in the same way. Specifically, much of the enrollment growth has been driven by adults and, up until recently, New York City residents. The net result is a Medicaid caseload that looks very different in many ways from the one in 2000.
Policy and Economic Changes Have Driven Enrollment Growth. In 2000, monthly Medicaid enrollment for the state averaged 2.7 million individuals. It inched up slightly in 2001, but did not begin to increase significantly until the following year. Annual enrollment increases of 9 percent or more in 2002 through 2004 can be tied in large part to three key changes that began in 2001. The first was the recession that began early in calendar year 2001 and continued into 2003, which reduced many New Yorkers’ family incomes and made them eligible for Medicaid.8 In April 2003, the lingering effects of the recession on state revenues prompted the federal government to temporarily increase the Federal Medical Assistance Percentage (FMAP), the share of Medicaid spending that is borne by the federal government. The higher FMAP provided New York, and other states, with less incentive to constrain Medicaid enrollment, at least in the short term.
The second major change was the Court of Appeals decision in Aliessa v. Novello in June 2001, which clarified and codified various categories of immigrants’ Medicaid eligibility. Specifically, the court ruled that the state must provide full Medicaid coverage to otherwise eligible legal residents who have been in the country for less than five years (legal residents were previously subject to a five-year waiting period for Medicaid eligibility), and to undocumented immigrants "permanently residing under color of law" (previously restricted to emergency Medicaid coverage only).9
The third and perhaps most significant change in the Medicaid program that occurred during this time period was the launch of Family Health Plus. Family Health Plus is administered as part of New York’s Medicaid system, but coverage is entirely through managed care companies and includes a slightly less generous benefit package than full Medicaid offers. It is open to adults with family income above the traditional Medicaid thresholds, but less than either 101 percent or 151 percent of FPL depending on whether they have children. It was rolled out across New York State in October 2001 through February 2002, and along with the economic downturn and Aliessa v. Novello, greatly increased the pool of Medicaid-eligible individuals.
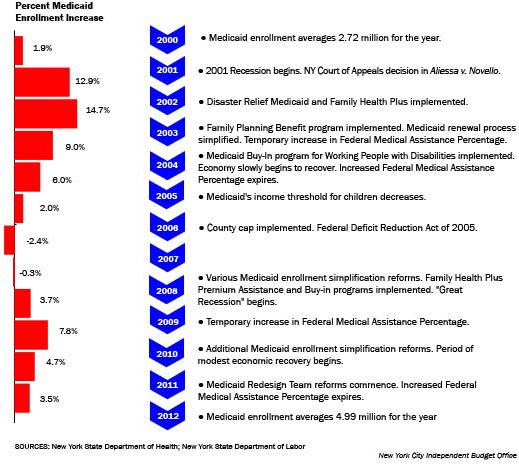
In addition to these three large changes, New York State introduced a number of smaller Medicaid expansion programs around this time, including Disaster Relief Medicaid. Disaster Relief Medicaid was established in New York City in the wake of the attack on the World Trade Center and the deepening recession. This program temporarily simplified and expedited the Medicaid eligibility and enrollment process for all low-income New Yorkers and automatically extended enrollment for those beneficiaries due for renewal. State DOH also implemented a number of enrollment and renewal simplification reforms that made it easier for eligible individuals to get and retain Medicaid coverage, including the relaxation of some asset reporting requirements and the introduction of a simplified renewal form. As a result of all these changes, monthly average Medicaid enrollment had climbed to 3.9 million New Yorkers by 2004, a 43.8 percent increase over 2000 levels.
Enrollment growth began to slow after 2004, due in part to the resumption of modest economic growth beginning in fall 2003. The state’s enhanced FMAP also expired in June 2004, rendering it more costly on the state and local levels to add enrollees to the program. In addition, both the state and federal governments introduced changes to eligibility rules during this time period that made it more difficult to qualify for Medicaid. First, in April 2005 New York State decreased the family income limit for children aged 6 to 18, shifting a number of them from Medicaid to Child Health Plus, which has a higher federal match rate (65 percent versus 50 percent of costs for regular Medicaid).10 A second factor slowing enrollment growth was the Federal Deficit Reduction Act of 2005, which included new citizenship and identity documentation requirements that went into effect for all Medicaid enrollees in July 2006. While this legislation did not change eligibility rules in New York State, the new, more onerous documentation requirements may have discouraged some eligible immigrants from applying or reapplying for coverage. (It likely also shifted more costs to the state and city, as the federal government will not provide matching funds for anything except emergency Medicaid in the case of immigrants who are ineligible under federal rules but who obtain full Medicaid coverage via the Aliessa decision.) The Deficit Reduction Act also contained provisions to gradually increase the look-back period for asset transfers in long-term care Medicaid, making it more difficult for higher-income individuals to qualify for that program.
Roughly at the same time that the Deficit Reduction Act’s Medicaid provisions went into effect, the state implemented the previously mentioned county cap financing arrangement. The county cap effectively severed the link between enrollment and local costs and incentivized localities to enroll all eligible individuals in Medicaid. This policy shift tempered some of the countervailing forces described above; nevertheless, average monthly enrollment actually fell slightly in 2007 from the 2006 level and then again in 2008. These decreases, together with moderate enrollment increases in 2005 and 2006, brought the statewide Medicaid rolls to 4.1 million individuals in 2008, a 5.2 percent increase over 2004 levels.
In the spring of 2008 the Great Recession hit New York State, and Medicaid enrollment began to tick back up starting in 2009 as more New Yorkers became eligible for coverage. The fiscal pressure on states once again prompted the federal government to temporarily increase the FMAP, this time starting in October 2008. The New York State Legislature also enacted a number of reforms in 2008 and 2010 that were designed to increase eligibility for Medicaid and further simplify the enrollment process. These included an increase in allowable income levels for the Medically Needy program (individuals with income above the standard threshold but with high medical expenses may subtract these expenses from their income, thereby "spending down" to reach Medicaid eligibility) and the elimination of the asset test, fingerprinting, and personal interview requirements for most new applicants. The state also introduced several Medicaid expansion programs at this time, including the Family Health Plus Premium Assistance and Buy-in programs.
Enrollment growth slowed somewhat in 2011 and then again in 2012 in the wake of the economic recovery that started throughout the state at the beginning of calendar year 2010 and brought strong employment growth in New York City. In April 2011, in preparation for the expiration of the temporarily enhanced FMAP in June, New York began implementing a comprehensive series of reforms designed to get the state’s ballooning Medicaid budget in check.
This reform effort, led by a newly appointed Medicaid Redesign Team, did not include any changes to eligibility rules or any major changes to benefits. However, limits on the number of visits were put in place for some services and mandatory enrollment in managed care plans was introduced for most new and existing enrollees. For the first time, the state also placed a strict spending cap on its Medicaid program, tying the annual growth in state funds to the consumer price index.11 It is unclear whether these efforts to rein in spending have had an indirect impact on enrollment growth, but the latter has undoubtedly slowed since 2010. Overall, the Medicaid caseload averaged 5.0 million individuals a month in 2012, an 8.4 percent increase over its size in 2010 and a 21.2 percent increase over its size in 2008.
Changes in the availability of employer sponsored insurance over time likely also played a role in Medicaid enrollment trends from 2000 through 2012. The State Department of Health, the source for the detailed Medicaid enrollment and expenditure data used in this analysis, does not keep comparable statistics for private insurance. The U.S. Census Bureau’s Current Population Survey has included questions about health insurance coverage since at least 2000; however, the sample size is quite small and the estimates are far less reliable than those that administrative data provide. Bearing these caveats in mind, the United Hospital Fund’s analyses of Current Population Survey data indicate that enrollment in employer sponsored insurance in New York State declined from 65 percent of the non-elderly population in 2000 to 55.5 percent in 2008-2009, putting upward pressure on Medicaid enrollment.12
Variation in Enrollment Trends by Eligibility Category and Region From 2000 through 2012, the largest enrollment increases in both absolute and percentage terms have been for adults. (Here and elsewhere in this report, "adult" refers to enrollees without disabilities ages 19 to 64.) Adult monthly Medicaid enrollment climbed from an average of just 618,200 individuals in 2000 to 1.9 million in 2012, a whopping 208.5 percent increase. Enrollment increases for children and seniors have been relatively more modest. Children’s average monthly Medicaid enrollment grew by 53.2 percent, from 1.2 million enrollees in 2000 to 1.8 million in 2012—about half the number of adults added to the rolls. During this same period monthly Medicaid enrollment for seniors and the disabled increased by 33.7 percent, from an average of 904,800 to 1.2 million. These differences persist once the Medicaid caseload is parsed by region: New York City, upstate, and the downstate suburbs all added more adults to the rolls than any other group.
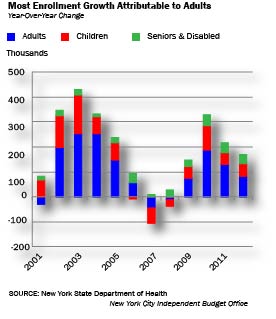
A number of different factors propelled the explosion of Medicaid enrollment among adults and, to a lesser extent, children. The creation of Family Health Plus clearly played a role in increasing adult enrollment, particularly in the 2002 through 2004 period. Another important factor is that adults are more likely than seniors or the disabled to be in the labor force with access to private insurance, making them—and their dependent children—more susceptible to changes in the economy and/or the availability of employer sponsored insurance. In fact, adults are the most reliant of any group on private insurance, since children also have access to publically subsidized insurance through Child Health Plus.
Over the 2002 through 2004 period, the number of adults and children on Medicaid rose by 700,900 and 358,900, respectively. Due to improvements in the economy and changes to eligibility rules, the number of adults and children enrolled in Medicaid dropped in 2007 and 2008, while seniors and the disabled continued to experience small year-over-year enrollment increases. Then in 2009 and 2010, as job losses mounted as a result of the Great Recession, the largest enrollment increases were once again for adults (enrollment growth of 262,100 or 18.3 percent over the two years combined), followed by children (combined enrollment growth of 144,200 or 9.1 percent).
In terms of regional trends, the majority of Medicaid enrollees have consistently come from New York City and early in the 2000 through 2012 period examined in this report, most enrollment growth also occurred here. From 1999 to 2000, Medicaid enrollment fell very slightly throughout the state, with the majority of enrollment losses occurring upstate and in the downstate suburbs.
When enrollment began to climb again starting in 2001, most of the increase was due to New York City residents. In 2001 and 2002, New York City was responsible for a staggering share of annual Medicaid enrollment growth in the state; although the city comprised just 42 percent of the state’s total population in 2000,13 it made up 84 percent of enrollment growth in 2001 and 80 percent in 2002. It is unclear what caused this particular spike, but one potential explanation is that the impacts of the Aliessa decision, the 2001-2003 recession, and/or the creation of Family Health Plus were felt more strongly in the city than elsewhere in the state. Another factor propelling enrollment growth in the city was Disaster Relief Medicaid, which was implemented during this period exclusively for city residents. Whatever the reasons, the percentage of enrollment growth due to New York City residents dropped in the following years, but stayed at or above 48 percent until 2007, when enrollment began to fall statewide. Overall, from 2000 through 2008, 67.9 percent of all Medicaid enrollment growth in the state occurred in New York City.
Changing Enrollment Patterns in the Wake of the Great Recession. Since 2008 and the onset of the most recent economic downturn, however, the majority of enrollment growth has occurred outside the city. From 2008 through 2012, 44.1 percent of overall enrollment growth happened in New York City, 35.2 percent of enrollment growth occurred upstate, and 20.7 percent happened in the downstate suburbs. When the entire 12-year period is considered, Medicaid has also been growing at a slower rate here than elsewhere. Since 2000, total Medicaid enrollment has increased by 75.0 percent in the city, compared with 87.4 percent upstate and 131.6 percent in the downstate suburbs. These general trends hold true for adults, children, and seniors and the disabled.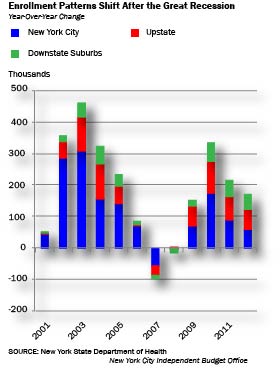
The uneven enrollment increases by eligibility category, and to a lesser extent by region, have resulted in significant changes in the composition of the state’s Medicaid caseload over this period. In 2000, children made up the largest share of Medicaid enrollees statewide (43.9 percent), followed by seniors and the disabled (33.3 percent). By 2012, adults had gone from the smallest group of enrollees (22.7 percent of all enrollees in 2000) to the largest (38.3 percent). Seniors and the disabled now comprise the smallest group of enrollees (24.3 percent), with children falling in between the two extremes (36.7 percent of enrollees).
|
Changes in the Composition of the Medicaid Caseload,
2000–2012 |
||||
|
|
2000 |
2012 |
||
|
Number |
Share |
Number |
Share |
|
|
New York City |
1,773,361
|
100.0% |
3,103,895
|
100.0% |
|
Adults |
436,483
|
24.6% |
1,251,286
|
40.3% |
|
Children |
798,758
|
45.0% |
1,136,167
|
36.6% |
|
Seniors/Disabled |
536,854
|
30.3% |
685,012
|
22.1% |
|
Upstate |
702,636
|
100.0% |
1,316,608
|
100.0% |
|
Adults |
138,584
|
19.7% |
453,701
|
34.5% |
|
Children |
299,902
|
42.7% |
482,384
|
36.6% |
|
Seniors/Disabled |
263,958
|
37.6% |
378,800
|
28.8% |
|
Downstate
Suburbs |
244,075
|
100.0% |
565,168
|
100.0% |
|
Adults |
43,176
|
17.7% |
202,398
|
35.8% |
|
Children |
96,658
|
39.6% |
212,371
|
37.6% |
|
Seniors/Disabled |
103,946
|
42.6% |
145,462
|
25.7% |
|
New York
State Total |
2,720,072
|
100.0% |
4,985,670
|
100.0% |
|
Adults |
618,243
|
22.7% |
1,907,384
|
38.3% |
|
Children |
1,195,317
|
43.9% |
1,830,922
|
36.7% |
|
Seniors/Disabled |
904,758
|
33.3% |
1,209,274
|
24.3% |
|
SOURCE: New York State Department of Health
NOTES: Region totals include additional enrollees
classified by the state as “other.”
Independent Budget
Office |
||||
Interestingly, this enrollment pattern is not consistent throughout the state. While all regions have seen a marked increase in adult Medicaid enrollment, adults have only surpassed children as the largest group of enrollees in New York City. In both the upstate and downstate suburban regions, children still slightly outnumber adults. Moreover, while seniors and the disabled are now the least numerous group in each region, the upstate and downstate suburban regions have comparatively larger shares of senior and/or disabled enrollees than the city.
Shifts have also occurred in the regional composition of New York State’s Medicaid population, though these have not been as dramatic. In 2000, 65.2 percent of all Medicaid enrollees resided in New York City, followed by 25.8 percent upstate, and 9.0 percent in the downstate suburbs. By 2012, this breakdown had shifted slightly to 62.3 percent of enrollees in New York City, 26.4 percent upstate, and 11.3 percent in the downstate suburbs. Since costs vary by both region and eligibility category, these and other changes in the composition of New York State’s Medicaid caseload have had an impact on expenditure growth over time.
|
Service Expenditures Versus Total Expenditures The expenditure numbers provided throughout this report are limited to service expenditures: that is, direct payments to providers or managed care companies for services used by specific Medicaid enrollees. In addition to service expenditures, total Medicaid expenditures include spending on items such as program administration and supplementary payments to hospitals and other health care facilities. In federal fiscal year 2011, New York’s total Medicaid expenditures were $51.7 billion and its service expenditures were $44.6 billion, or 86 percent of the total.
|
While IBO’s analysis of Medicaid costs focuses solely on service expenditures, other research examining specific types of non-service spending has found similar results in terms of the costs in New York City versus elsewhere in the state. For example, a 2009 analysis by the United Hospital Fund found that in state fiscal year 2007-2008 New York City received $464 million in Medicaid administration dollars, 58.8 percent of all spending on local-level administration.14 This equates to only $171 in annual administrative spending per Medicaid enrollee; the average for other counties in the state is $234.
Similarly, a detailed analysis of Indigent Care Pool payments released by the Community Service Society in 2012 shows that $731.7 million out of $1.2 billion went to New York City hospitals in calendar year 2010.15 This translates into 61.9 percent of total Indigent Care Pool payments, or $243 per New York City Medicaid enrollee. The rest of the state receives a smaller share of total funds, but a higher amount per Medicaid enrollee ($263).
These trends may be different in terms of the supplementary Medicaid funds given out to health care facilities through direct, lump sum payments, however. In New York City, the Bloomberg administration has expanded the use of these payments in recent years, as a means of leveraging additional federal dollars to bolster city funding for the Health and Hospitals Corporation.
Expenditure Growth, 2000–2012
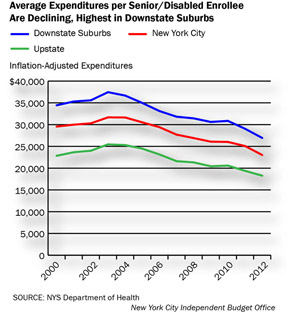
While total New York State Medicaid enrollment climbed 83.3 percent from 2000 through 2012, expenditures rose more slowly, increasing 25.2 percent after adjusting for inflation. Average annual costs per Medicaid enrollee have declined in real terms for every region and eligibility category over that period. On a regional basis, New York City’s share of total expenditures has declined since 2000, though it remains the majority. Moreover, the downstate suburbs and not the city have consistently had the highest cost per enrollee of any region, due in part to a higher concentration of the most costly senior and disabled enrollees.
Enrollment Growth has Outpaced Increases in Expenditures. Analysts and public officials concerned about Medicaid spending often focus on the overall size of its budget and the very rapid growth in the cost of the program over time. Spending on Medicaid services increased from $22.7 billion in 2000 to $44.5 billion in 2012, an increase of 96.1 percent in nominal terms and 25.2 percent in real (inflation-adjusted) terms. Over the same period, enrollment grew by 83.3 percent. As a result, the real annual cost per enrollee has decreased by 31.7 percent, from $13,100 to $8,900.
Moreover, declines in inflation-adjusted average costs have occurred for all regions and eligibility groups since 2000. In New York City, for example, real costs per enrollee have declined from $9,300 to $5,500 for adults, from $3,900 to $3,100 for children, and from $29,600 to $23,000 for seniors and the disabled. There are some regional differences in trends, however. Costs per enrollee declined less steeply for adults and children upstate, 14.4 percent and 10.4 percent, respectively, than for adults and children elsewhere in the state. Across all regions and eligibility categories, the real cost of caring for the average Medicaid enrollee has fallen by 31.7 percent since 2000.
|
Decreases in the Inflation-Adjusted Cost Per
Medicaid Enrollee, 2000–2012 |
|||
|
|
2000 |
2012 |
Percentage Change |
|
New York City |
$13,152
|
$8,958
|
-31.9% |
|
Adults |
9,303
|
5,495
|
-40.9% |
|
Children |
3,915
|
3,141
|
-19.8% |
|
Seniors/Disabled |
29,556
|
23,029
|
-22.1% |
|
Upstate |
$11,106
|
$8,117
|
-26.9% |
|
Adults |
6,175
|
5,286
|
-14.4% |
|
Children |
3,051
|
2,732
|
-10.4% |
|
Seniors/Disabled |
22,842
|
18,275
|
-20.0% |
|
Downstate Suburbs |
$18,107
|
$10,658
|
-41.1% |
|
Adults |
9,817
|
5,837
|
-40.5% |
|
Children |
3,942
|
3,167
|
-19.7% |
|
Seniors/Disabled |
34,436
|
26,944
|
-21.8% |
|
New York State Total |
$13,068
|
$8,929
|
-31.7% |
|
Adults |
8,637
|
5,482
|
-36.5% |
|
Children |
3,700
|
3,036
|
-17.9% |
|
Seniors/Disabled |
28,158
|
22,011
|
-21.8% |
|
SOURCE: New York State Department of Health
NOTES:
Costs include the federal, state, and local shares
of Medicaid, and exclude spending on administration
and supplemental hospital payments. Region totals
include additional enrollees classified by the state
as “other.”
New York City
Independent Budget Office |
|||
One potential explanation for this systemwide decrease in real per enrollee spending is that recent recessions, changes in the availability of employer sponsored insurance, and eligibility expansions have brought healthier enrollees—who use fewer and less costly services—into the program. This would certainly seem to be the case with the adult population, as the Family Health Plus program launched in 2002 specifically targets nondisabled adults and offers fewer benefits than traditional Medicaid. However, the rapid expansion of managed care over the past decade makes it challenging to directly compare types and amounts of services used in 2000 compared with 2012. For example, state DOH data show that the average enrollee in fee-for-service Medicaid used 1.8 hospital inpatient days in 2000 and only 1.2 days in 2012. At the same time, enrollment in Medicaid managed care increased dramatically.16 Since the state does not publically release data tracking the services Medicaid managed care members use, it is impossible to tell from this data alone whether hospital utilization has actually gone down.
Another currently popular hypothesis is that the large scale shift from a fee-for-service to a managed care model has reduced per enrollee spending. While Medicaid managed care existed in 2000, comparatively few New Yorkers were enrolled, and it accounted for only 5.6 percent of total service expenditures for New York City residents. By 2012, managed care was compulsory for most enrollees not under long-term care, and its share of New York City Medicaid expenditures had increased to 40.8 percent. As has already been discussed, real per-enrollee Medicaid costs declined significantly during this period as well. However, given the myriad policy and economic changes occurring at the same time, it is difficult to tease out the independent impact of the managed care expansion. Moreover, evidence of whether managed care has actually reduced costs in other settings is mixed at best.17
Alternatively, declining per enrollee costs could be explained by provider reimbursement rates that have not kept pace with inflation. Provider rates have been cut repeatedly in recent budget cycles, but it is difficult to directly measure the impact of this factor. If there has in fact been an influx of healthier patients into the program, that would likely lead to decreases in the average cost per service unit, as some Medicaid rates are adjusted based on the type and severity of illness. Moreover, the state has overhauled its reimbursement rate methodology for several different service types in recent years, so service units in 2000 are not strictly equivalent to service units in 2012.18 Finally, Medicaid managed care companies pay providers directly for services used by their members, so the state’s service unit data is mainly useful for looking at fee-for-service Medicaid, which is declining in importance.
Despite these difficulties, a simple comparison of the average cost per service unit in 2000 versus 2012 can be computed and shows that in real terms, the average has declined over time for most types of service. Specifically, the inflation-adjusted cost per service unit has gone up over time for managed care premiums, dental procedures, and intermediate care facility days, and decreased for the other 10 types of services that the state tracks. Turning to the hospital example again, the statewide average cost for one inpatient day has declined from $1,700 to $900 since 2000. The average cost for one outpatient visit or claim has decreased even more, from $170 to $30 in real terms.
While many of these potential explanations for declining per enrollee costs are suggestive, none can be conclusively proven or disproven with the available data. Given that Family Health Plus was specifically targeted to comparatively healthy adults and that the adult population has seen the sharpest declines in per enrollee costs in much of the state, it seems most likely that an influx of healthier enrollees did play some role in falling costs. However, one or both of the other explanations cited above—the expansion of Medicaid managed care and falling or flat provider rates—could also be partially responsible.
Variation in Expenditure Trends by Eligibility Category and Region. As with enrollment, New York City has consistently been responsible for a majority of the state’s Medicaid expenditures, but the city’s share has shrunk slightly over time. Of the $35.5 billion (measured in 2012 dollars) in total state Medicaid service costs in 2000, $23.3 billion, or 65.6 percent, were for New York City residents. That same year, upstate residents accounted for 22.0 percent of Medicaid expenditures, with the remaining 12.4 percent of expenditures attributable to residents of the suburbs downstate. By 2012 the regional shares had shifted, with New York City responsible for 62.5 percent of expenditures, upstate for 24.0 percent, and the downstate suburbs for 13.5 percent.
|
New York City’s Share of Medicaid Expenditures Has
Declined
Inflation Adjusted,
dollars in millions |
|||||
|
|
2000 |
2012 |
Percent
Increase 2000-2012 |
||
|
Dollars |
Share |
Dollars |
Share |
||
|
New York City |
$23,323
|
65.6% |
$27,806
|
62.5% |
19.2% |
|
Upstate |
7,803
|
22.0% |
10,687
|
24.0% |
37.0% |
|
Downstate Suburbs |
4,419
|
12.4% |
6,024
|
13.5% |
36.3% |
|
TOTAL Medicaid Expenditures
|
$35,546
|
100.0% |
$44,516
|
100.0% |
25.2% |
|
SOURCE: New York
State Department of Health
NOTES: Totals
include the federal, state, and local shares of
Medicaid, and exclude spending on administration and
supplemental hospital payments.
New York City
Independent Budget Office |
|||||
Average Medicaid costs per recipient in New York City fall between average costs in the downstate suburbs and costs upstate. In 2012, the average annual service cost for a downstate suburban Medicaid enrollee was $10,700, followed by $9,000 for a New York City enrollee, and $8,100 for an upstate enrollee. This pattern—the per enrollee cost highest in the downstate suburbs and lowest upstate—has persisted since at least 2000. Part of the reason why upstate enrollees are consistently less expensive than those downstate is that some Medicaid rates are adjusted based on regional differences in health care costs. However, geographic differences cannot explain why downstate suburban enrollees are more costly than those in the city, since the cost of health care is similar in both areas.
One likely factor in the downstate suburban region’s higher per enrollee cost is that the suburbs have a greater concentration of senior and disabled enrollees than New York City—25.7 percent compared with 22.1 percent in 2012. This is significant because seniors and the disabled have consistently been the most costly Medicaid enrollees to care for in every region. In 2012, the average annual cost of a senior or disabled enrollee ranged from $26,900 in the downstate suburbs to $23,000 in New York City to $18,300 upstate. In comparison, average 2012 Medicaid costs for adults ranged from $5,800 in the downstate suburbs to $5,300 upstate and from $3,200 in the downstate suburbs to $2,700 upstate for children that same year.
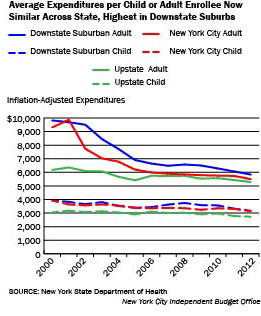
Even when the adult or child population is examined independently, however, the downstate suburbs still have the highest average cost per enrollee. In 2012, these costs averaged $5,800 for adults and $3,200 for children in the downstate suburbs, compared with $5,500 for adults and $3,100 for children in the city. Moreover, the downstate suburban region has had the highest per enrollee costs for adults and children since 2002 and 2005, respectively. The downstate suburbs have also consistently had the highest cost of providing care for seniors and the disabled. While these differences in costs are relatively small in many cases, they suggest that Medicaid recipients on average are using more, or more costly, services in the downstate suburbs than in New York City.
Additional Changes to the Medicaid Caseload on the HorizonOver half of the enrollment growth in New York State’s Medicaid program since 2000 has been driven by nondisabled adults. This is due in part to the launch of enrollment expansion programs targeted specifically to adults such as Family Health Plus. Another factor was adults’ greater reliance on employer-provided health insurance, which many adults lost in the recessions that bracketed the decade. On a regional level, New York City was responsible for the preponderance of Medicaid enrollment increases in the early part of the decade. However, the majority of enrollment growth after the most recent economic downturn has occurred upstate and in the downstate suburbs. Moreover, while there has been a marked increase in adult enrollment upstate and in the downstate suburbs since 2000, children still slightly outnumber adults on the Medicaid rolls in these two regions. This is despite the fact that adults comprise the majority of the poverty-level population in every region in the state.
19 Therefore, these may be the areas with the greatest potential for further growth—in the form of increased enrollment among eligible adults—under the Affordable Care Act’s Medicaid expansion.With regard to Medicaid expenditures, New York City’s share of the statewide total has also shrunk slightly over time, and its per enrollee costs trail those in the suburban counties surrounding the city. Overall, real Medicaid expenditures have not grown at the same rate as enrollment, resulting in a decreased cost per enrollee systemwide. While there are a number of potential explanations for declining per enrollee costs, including the expansion of managed care and lagging provider payment rates, it is likely that the decrease is at least partially due to a large influx of healthy adults into the program via Family Health Plus.
The fact that a large infusion of healthy adults into the system can lower per enrollee costs is significant in terms of projecting future expenditures because the ACA’s Medicaid expansion is aimed at a similar demographic. It is also significant that previous increases in the federal share of Medicaid costs—in the wake of the 2001 and 2008 recessions—have all coincided with increases in enrollment and have all resulted in the implementation of cost-cutting measures once they expire. The Affordable Care Act promises new increases in the FMAP specifically for adults starting in 2014, but unlike in the earlier examples, the statute contains no expiration date.20
Exactly how implementation of the Affordable Care Act, in combination with New York State’s ongoing Medicaid reform effort, will affect enrollment and expenditures throughout the state remains an important open question.
Report prepared by Christina Fiorentini
Endnotes
1
Unless otherwise noted, all references to years—in the context of both enrollment and expenditures—refer to city fiscal years and all Medicaid enrollment totals are the average of each month’s enrollment during a given year.2
Unless otherwise indicated, all Medicaid expenditure numbers are all funds numbers (include federal, state, and local shares), refer only to spending on services, and exclude spending on administration and supplemental hospital payments.3
All inflation adjustments were made using IBO’s state and local government deflator with a base year of 2012. This deflator was created specifically for use with government spending and was calculated based on Moody’s Analytics economic forecast for New York City, November 2012.4
In federal fiscal year 2011, New York State’s Medicaid expenditures were second only to those of California. Source: U.S. Centers for Medicare and Medicaid Services, Financial Management Report for FY 2002 through FY 2011, as of September 2013.5
The Disproportionate Share Hospital and Upper Payment Limit programs provide supplemental Medicaid funds to hospitals serving a disproportionate share of uninsured and Medicaid patients. The lump sum payments the city’s Health and Hospitals Corporation receives through these programs are jointly financed by the city and federal governments.6
The Affordable Care Act includes provisions that fund the Children’s Health Insurance Program (called CHIP nationally and Child Health Plus in New York State) through September 30, 2015 and authorize it through federal fiscal year 2019.7
Medicaid Institute at United Hospital Fund, "Revisioning" Medicaid as Part of New York’s Coverage Continuum, January 2011.8
Start and end dates for recessions referenced in this section are based on New York State Department of Labor data.9
A person "permanently residing under color of law" is living in the country with the knowledge of immigration officials and without threat of deportation. He or she is considered to have the same rights as legal residents for welfare eligibility purposes in New York State.10
Under the ACA, New York State is now required to shift almost this exact group of children—those with family income from 100 to 138 percent of FPL—back into the Medicaid program. However, the state will continue to obtain the higher CHIP matching rate for them. In addition, the overall CHIP federal matching rate is scheduled to increase by 23 percentage points starting in federal fiscal year 2015.11
If expenditures are projected to go above the Medicaid Global Cap, the Commissioner of state DOH has the authority to take action to bring spending down without first going through the Legislature. Such action may include changes to reimbursement rates and utilization restrictions, but may not include changes to eligibility levels. To date, these so-called "super powers" have not been used.12
United Hospital Fund, Health Insurance Coverage in New York, 2001, June 2003; and United Hospital Fund, Health Insurance Coverage in New York, 2009, Sept 2011.13
U.S. Census Bureau, Census 2000 Summary File 1.14
Medicaid Institute at United Hospital Fund, The Role of Local Government in Administering Medicaid in New York, August 2009.15
Community Service Society, Incentivizing Patient Financial Assistance: How to fix New York’s Hospital Indigent Care Program, February 2012.16
One indicator of this is that the average number of monthly managed care premiums per Medicaid enrollee rose from 2.9 in 2000 to 8.4 in 2012.17
Evidence on the impact of managed care on the cost of providing health services is mixed. For a range of results, see the following studies: The Lewin Group, Medicaid Managed Care Cost Savings – A Synthesis of 24 Studies, updated March 2009; Duggan and Hayford, "Has the Shift to Managed Care Reduced Medicaid Expenditures? Evidence from State and Local-Level Mandates," NBER Working Paper No. 17236, July 2011; and the Massachusetts Office of the Inspector General, Report Pursuant to Section 156 of Chapter 68 of the Acts of 2011: Rates of Reimbursement to Providers in the MassHealth MCO Program, July 2012.18
Examples of payment reforms include the switch to an All Patient Refined Diagnosis Related Groups model for hospital inpatient services and to an Ambulatory Patient Groups model for outpatient and ambulatory care in 2008 and 2009.19
Looking just at those individuals with family income at or below 100 percent of FPL, adults make up 59 percent of this population upstate, 56 percent of this population in New York City, and 53 percent of this population in the downstate suburbs. Source: U.S. Census Bureau, 2011 American Community Survey Public Use Microdata Sample.20
The ACA provides for two types of increased FMAPs for states that elect to offer Medicaid coverage to adults at up to 138 percent of FPL. The "newly eligible" FMAP is available to offset costs for adults who had been ineligible under state rules as of 2009. This FMAP starts out at 100 percent of costs in calendar year 2014 and gradually phases down to 90 percent in calendar year 2020 and beyond. The "expansion state" FMAP is available to offset costs for non-pregnant childless adults in states that offered coverage to this group prior to the enactment of the ACA. This FMAP is equal to the regular FMAP (50 percent in New York State) plus a transition percentage. The transition percentage will gradually increase until the "expansion state" FMAP is equal to the "newly eligible" FMAP, which will occur in calendar year 2019 and beyond. New York State is expected to benefit more strongly from the "expansion state" FMAP, which in its case will start out at 75 percent in calendar year 2014.PDF version available here.
Receive notification of free reports by e-mail