Introduction
Over the past several months the
Department of City Planning has outlined its proposed East
Midtown rezoning initiative in a series of public reports
and presentations. The new zoning regulations would
encourage the redevelopment of the neighborhood’s existing
building stock by allowing developers to build taller and
denser than currently permitted. The proposal officially
began the Uniform Land Use Review Procedure (ULURP) process
on April 22 of this year, which includes reviews by the
local community boards, the Manhattan Borough President, the
City Planning Commission and, ultimately, the City Council.
The city planning department and
the supporters of the rezoning proposal have argued that the
office buildings in East Midtown, and particularly the
blocks surrounding Grand Central, are outdated, inefficient
and ill-suited to the needs of modern office tenants. This
is due, in part, to current zoning regulations that
discourage landlords in East Midtown from replacing their
inefficient buildings with modern structures. Many buildings
in the area, particularly those built before 1961, are
larger than could be built under the current zoning code.
As a result, the Grand Central
submarket has seen little new development over the last
several decades, and the amount of new office stock added to
the area has fallen well short of what was built before the
current zoning rules were put in place in the early 1980s.
Supporters of rezoning argue that unless the zoning code is
revised, East Midtown—and, by extension, New York City—will
be less competitive on the global stage as compared with
peer cities like Chicago, London, and Tokyo.
The proposal includes several
provisions intended to benefit the area’s existing workers,
residents, and visitors. The new zoning text includes
provisions in which developers could purchase additional
density from a District Improvement Fund in order to reach
the maximum development potential of their sites. The money
raised by the fund would be used to pay for capital
improvements to the area’s pedestrian and transportation
infrastructure. New buildings would also be required to meet
a higher energy efficiency standard than required at sites
elsewhere in the city.
Based on estimates in the final
scope for the project’s Environmental Impact Statement, the
rezoning could lead to 13.5 million square feet of new
development throughout East Midtown, including between 8.2
million square feet and 10.3 million square feet of office
space, of which as much as 3.7 million would be net new
space.
Some elected officials and
advocates, however, are concerned the rezoning is proceeding
too quickly and that more time is needed to understand the
impact these new buildings will have on the public realm.
Given that crowded conditions already exist in the area,
they contend that the capital improvements to the area’s
pedestrian and transit network should precede development of
new commercial space and question whether payments by
developers into a District Improvement Fund will be too
volatile a funding source for the needed improvements. Some
are concerned that the rezoning will target historic
buildings for redevelopment. Still others have questioned
whether the rezoning will draw tenants and development
interest away from other active redevelopment areas,
including the World Trade Center, Downtown Brooklyn, and
Hudson Yards, where the
city is spending $3 billion to spur the creation of a new
central business district with more than 25 million square
feet of office space. In response to this last concern,
developers will not be able to receive building permits for
projects approved under the new zoning rules until July
2017.
In this report, requested by
Council Member Daniel Garodnick, IBO updates its 2004
report, "
Supply
& Demand: City and State May Be Planning Too Much Office
Space," to look at the
future of the office market in New York City. That report
forecast employment growth among office-using industries
from 2010 through 2035, translated those gains into demand
for new office space, and compared that estimate with the
amount of potential office development capacity proposed in
several rezonings that were pending at that time. In this
update, IBO projects citywide growth through 2040 and
compares the forecast demand with an updated estimate of
development capacity that includes Hudson Yards, the World
Trade Center, Long Island City, Downtown Brooklyn, Atlantic
Yards, and the proposed East Midtown rezoning.1
|
East
Midtown District Improvement Fund
The zoning proposal acknowledges that
increasing density in the area will add to already
overburdened transportation and pedestrian networks.
Foregoing the option to use the city’s general capital
budget to finance improvements to help mitigate the
pressure, the proposed rezoning of East Midtown includes a
financing mechanism known as the District Improvement Fund
(DIF) to raise revenue from the sale of additional
development rights. The fund is similar to the one that the
city employed when it rezoned the Far West Side of
Manhattan. Under the current proposal, developers can choose
to pay a bonus for each incremental square foot of space
they build over what is allowed as-of-right, up to a maximum
amount of space that varies based on a lot’s location. After
acquiring a minimum amount of floor area from the DIF,
developers can also add density by purchasing unused
development rights from neighborhood landmarks, including
Grand Central Terminal and St. Patrick’s Cathedral, instead
of buying air rights from the DIF.
The city has
proposed a price of $250 for each square foot of commercial
development rights acquired through the District Improvement
Fund. (The price for residential space will be determined at
a future date.) The price will be adjusted annually based on
the percent change in the Mayor’s Office of Management and
Budget’s estimate of the average asking rent for office
space in Midtown Manhattan. (Since developers cannot secure
building permits based on the new zoning regulations until
2017, it is unclear whether the DIF price will rise between
the rezoning’s enactment date and 2017, when developers will
be eligible to receive building permits, or whether it will
start at $250 at that time.)
Based on this pricing structure,
the city estimates that the DIF will raise between $605
million and $750 million over 20 years (present value). Even
though the city planning department estimates that there are
only 19 probable development sites that will take advantage
of the rezoning, the department has not provided a
site-by-site breakdown of expected DIF revenue. It has
estimated that the range of contributions could vary from
$30 million to $100 million per site. It also has not
estimated the timing or pace at which it expects to collect
DIF revenue or the extent to which allowing owners of
landmarks to sell unused development rights might divert
revenue from the District Improvement Fund.
The city’s proposal calls for the
creation of a District Improvement Fund Committee, which
will be tasked with deciding how and where DIF revenue is
spent. In the most recent version of the East Midtown zoning
amendment, the DIF Committee will identify capital projects
in or adjacent to East Midtown that are intended to improve
the neighborhood’s pedestrian networks; build new open
space; or mitigate the impacts of new development projects.
The committee will include five members, all of whom will be
appointed by the Mayor, and will be headed by the Chair of
the City Planning Commission. The committee would include
fewer points of view than the boards of other quasi-public
local development corporations. The board of the Hudson
Yards Development Corporation, for example, includes eight
mayoral appointees, plus the Comptroller, the Speaker of the
City Council, the Council Member representing the
neighborhood, the Manhattan Borough President, and the Chair
of Community Board 4. As IBO
completed this rpeort, the city’s planning department
indicated that it was open to considering changes in the
composition of the DIF Committee and the per square foot
price of development rights purchased through the fund.
The Final Scope of Work for the
project’s Environmental Impact Statement recommends that the
committee prioritize the renovation of subway platforms and
mezzanines in Grand Central station and the conversion of
Vanderbilt Avenue into a pedestrian plaza. Depending on the
availability of funding, future projects could include
streetscape and sidewalk improvements along Madison Avenue,
Lexington Avenue, and East 53rd Street, as well
as improvements to the 5th Avenue/53rd
Street and Lexington Avenue/53rd Street subway
stations. The city planning and transportation departments
recently hired a consultant to write an "East Midtown Public
Realm Vision Plan," which the agencies expect will propose
specific capital projects in greater detail. At the time of
this report, city planning has not publicly released the
estimated cost of these projects. The ultimate decision of
which projects to fund and the order in which they will be
funded would be left to the discretion of the DIF Committee.
Many of these projects would
address concerns about congestion in Midtown that date back
to at least the 1970s. The "Midtown Development" report,
released by the Department of City Planning in 1981 in
support of the proposal to create the Special Midtown
District, highlighted the need for significant investments
to ease overcrowding in East Midtown. Among the proposed
projects were recommendations to widen the Madison and
Lexington Avenues sidewalks to at least 17 feet; improve
pedestrian circulation along East 53rd Street and
Vanderbilt Avenue; and relieve congestion above and below
ground at Grand Central. The projects included in the city’s
current DIF proposal tackle these same issues, which have
largely gone unaddressed in the three decades since the
Special Midtown District was approved. The special district,
which was enacted in 1982, first established the zoning
restrictions in East Midtown that the Mayor is currently
proposing to revise.2
In a recent opinion article, Mayor Bloomberg suggested
that the city might pay for at least some of the East
Midtown capital improvements using city capital funds and
use future DIF revenue to reimburse the city over time. Such
an agreement between the city and the DIF Committee would
most likely be structured similarly to the arrangement
between the city and the Hudson Yards Development
Corporation and the Hudson Yards Infrastructure Corporation.
Experience with the Hudson Yards equivalent of the DIF
(known as a DIB, or district improvement fund bonus),
however, has shown that such funding is that project’s most
volatile source of revenue. Annual DIB revenue in Hudson
Yards has ranged from as much as $58 million in fiscal year
2007 to as little as $0 in fiscal year 2010. The city has
not said whether all of the envisioned capital projects will
proceed if DIF revenue falls short of the total of the
projected costs.
|
Forecasting Demand for
Office Space
As discussed in IBO’s 2004 report,
forecasting long-term demand for office space is highly
sensitive to both projected employment growth and to how
intensively firms use office space. Those factors are, in
turn, a product of the broader economy, changes in the
city’s local economic conditions, tax incentives, inter- and
intra-regional competition, technological innovations,
changes in workplace design, as well as other developments
that we cannot yet envision. Making assumptions about
employment and the use of office space, IBO estimates that
roughly 52 million square feet of office space would need to
be developed to meet projected citywide employment growth
through 2040. However, this long-term forecast of demand
comes with a large margin of error. Depending on the rate of
employment growth and space utilization trends, by 2040
demand for new space could be as little as 30 million square
feet or as much as 87 million square feet.
Employment Forecast.
Historical trends in employment in the office-using
industries are used to generate an employment forecast
through 2040. IBO’s definition of office-using employment
includes the three sectors that represent the largest share
of demand for office space in the city: information,
financial services, and professional and business services.3
Estimates of annual employment by industry from 1970 on are
provided by Moody’s Analytics. IBO added its own employment
estimate for 1969, a cyclical peak, which was not available
from Moody’s. To estimate office-using employment, we looked
at trends in total employment in New York City and
employment in the city’s finance, insurance, and real estate
industry. Both of these series peaked in 1969, declining
1.37 percent and 1.34 percent, respectively, from 1969 to
1970. IBO assumes a comparable, 1.35 percent, decline in
office-using employment for the year.
To get a
sense of how the demand for office space has grown over
time, we calculated the long-term, peak-to-peak employment
growth rates for the combined information, financial
services, and professional and business services industries
in New York City since 1969. Average annual growth rates are
highly dependent on the beginning and end years selected,
and peak-to-peak trends best capture the need for new office
development as the city’s employment base grows across
multiple business cycles. By using peak-to-peak employment
growth rates to model growth in office-using industries, we
are assuming that employment growth during recoveries will
eventually be offset—at least in part—by job losses during
recessions. The office-using industries’ peak-to-peak
employment growth rates have fallen over the past three
business cycles, slowing from increases averaging 0.63
percent annually from 1969 through 1988 to declines
averaging 0.24 percent a year during the most recent cycle.
|
Growth in Office-Using
Employment Slowed Over Time
|
|
Peak-to-Peak
Economic Cycles
|
Average Annual
Growth Rate
|
|
1969-1988
|
0.63%
|
|
1988-2000
|
0.55%
|
|
2000-2008
|
-0.24%
|
|
1969-2008
|
0.43%
|
|
SOURCES: Moody’s
Analytics; Bureau of Labor Statistics, Current
Employment Statistics
NOTES: Employment
totals are estimated by Moody’s Analytics to bridge
between multiple industrial classification systems
and data sources. Employment for 1969 was estimated
by IBO based on data from the US Bureau of Labor
Statistics’ Current Employment Statistics data.
Independent
Budget Office
|
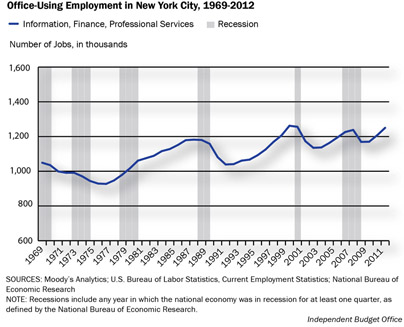
Overall, citywide office-using
employment is roughly at the same level it was more than a
decade ago. As of the end of 2012, there were nearly 1.25
million workers employed in the three office-using
industries. Collectively, the three sectors that make up
IBO’s definition of office-using employment have recovered
all of the jobs lost since 2008, though they have yet to
surpass their previous peak in 2000. There are a number of
possible explanations for this continued weakness,
including: the increasing use of technology; the
near-shoring, off-shoring, and/or elimination of back-office
occupations; and structural shifts in office-using
industries in the city, particularly in the financial
services sector.
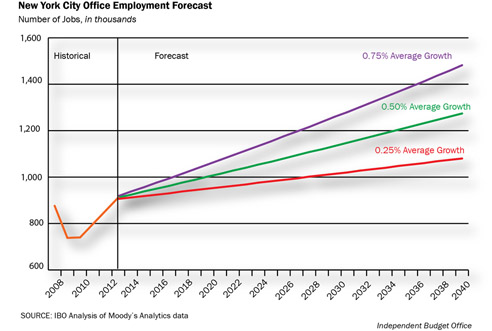
Based on these historical trends,
IBO projected office-using employment in New York City
through 2040. We modeled three scenarios based on different
annual growth rates derived from our analysis of long-term,
peak-to-peak employment growth:
•
0.75 percent (an optimistic scenario that reflects
the city’s strong job growth since the end of the
2009 recession);
•
0.5 percent (roughly the long-term growth rate
between 1969 and 2008); and
•
0.25 percent (a pessimistic scenario).
These various growth rates were
then applied to the 2012 office-using employment base. Using
2012 as the base year underestimates future employment
because we are applying our long-term growth rates to a
point in time in the middle of an economic expansion, rather
than at the cycle’s peak. This is preferable to starting our
forecast from the 2008 peak, which would have omitted data
on employment trends from 2008 through 2012. Moreover, 2012
office-using employment has surpassed its 2008 peak.
Based on these assumptions, New
York City would add between 91,000 new jobs in the more
pessimistic case and 291,000 office jobs in the more
optimistic scenario. The midrange scenario of 0.5 percent
annual growth, which is closest to the long-term annual
growth rate since 1969, would result in 187,000 new office
jobs by 2040. The uncertainty in the forecast increases over
time. Through 2020, the difference between the optimistic
and pessimistic scenarios is 52,000 jobs. By 2040, the
difference grows to more than 200,000 jobs.
Demand Forecast.
These employment growth scenarios can
be used to estimate the demand for new office space. Over
time, employment growth will reduce the overall vacancy rate
enough to justify the construction of new buildings. By
multiplying the total employment increase by an estimate of
the amount of space required per worker, we can estimate the
total amount of new development needed to accommodate this
projected growth.
Like
employment growth rates, space utilization rates have varied
over time. Traditionally, office designers have estimated
that workers require 250 square feet of space per person.
The amount of office space needed for each worker, however,
has steadily fallen in recent years for a variety of
reasons, including the decreasing need for file storage and
server space, the increasing popularity of open floor plans,
a renewed focus on controlling costs as firms in New York
compete in a worldwide market for financial and business
services, and the rise of telecommuting and shared
workspaces. Several commercial real estate experts have
predicted that firms could allocate as little as 100 square
feet per worker by the end of the decade.4
To account for the range of
potential firm decisions, IBO applied four utilization rates
to each of the employment growth scenarios discussed above.
The utilization rates vary from a high of 250 square feet
per worker to a low of 175 square feet per worker; the
latter figure is roughly in line with what firms currently
allocate per worker when leasing space.
The model also allows the overall
market to return to a natural vacancy rate of 8 percent, the
point at which supply and demand are balanced and lease
rates are stable. According to Cushman & Wakefield’s final
2012 market report, the vacancy rate in Manhattan was 9.4
percent, meaning that the market would need to absorb 5.5
million square feet of space before new construction would
be considered viable. We have chosen to focus on vacancy
rates in Manhattan’s central business districts since there
appears to be little demand for new office construction in
other areas of the city.
Other Factors Affecting Long-Term
Demand. Other factors that might affect the long-term
demand include conversion or demolition of existing office
buildings and changes in how office space is used. It is
difficult to estimate the total amount of office space that
has been converted to other uses in recent years. It is
likely that most conversion activity over the past two
decades resulted from the now-expired 421-g incentive
program, which encouraged property owners to convert office
buildings in Lower Manhattan into apartments. From 1995
through 2006, the years in which the exemption was
available, developers converted nearly 12.8 million square
feet of offices into residential buildings.
Conversion activity has slowed in
the years since then, but it appears that developers are
continuing to convert older office buildings even in the
absence of a dedicated tax incentive. Notable projects
include apartment conversions at 116 John Street and 114
East 32nd Street in Manhattan and 25 Washington
Street in Brooklyn; a retail conversion at 3 West 57th
Street; and hotel conversions at 140 Washington Street, 960
6th Avenue, and 1164 Broadway. Based on media
reports, current and future conversion projects include
Sony’s headquarters at 550 Madison Avenue, 346 Broadway, the
former Emigrant Savings Bank at 49-51 Chambers Street, the
upper floors of the Woolworth Building, and AIG’s former
headquarters at 70 Pine Street.
For the purposes of this analysis,
IBO has assumed that by 2040, owners of office properties in
Manhattan’s central business districts and in Downtown
Brooklyn, neighborhoods that feature both strong residential
demand and a preponderance of the city’s oldest office
buildings, will convert or demolish 10 percent of those
neighborhoods’ prewar office space and 5 percent of its
space built from 1946 through 1961. This amounts to a total
of 19.9 million square feet in conversions and demolitions,
or an average of 738,000 square feet per year. If employment
growth remains steady, the market would need to replace the
space that is lost.
Some of the demand created by
conversions and demolitions might be offset if businesses
decide to shrink their office footprints over time. If the
city’s existing office-using industries, as defined in this
report, were to collectively reduce their space utilization
rates by as little as 6 percent—the equivalent of going from
250 square feet per worker to 234 square feet per worker—the
additional vacant space would more than offset all of the
extra demand generated by conversions and demolitions. Given
the speculative nature of how and when businesses might
reconfigure their existing office space, our model does not
consider potential reductions in the amount of space
currently occupied by the existing office workforce.
|
Office Employment and Space Requirements Through 2040
|
|
|
Average Annual Growth Rate
|
|
|
0.75%
|
0.50%
|
0.25%
|
|
Office
Employment
(thousands of jobs)
|
|
|
|
|
Level in 2040
|
1,540.5
|
1,437.0
|
1,340.2
|
|
Gain from 2012-2040
|
290.8
|
187.3
|
90.5
|
|
Space
Required Assuming 8% Vacancy Rate, 19.9 msf in
Conversions
(millions of square feet)
|
|
|
|
|
250 square feet per job
|
87.1
|
61.3
|
37.1
|
|
225 square feet per job
|
79.9
|
56.6
|
34.8
|
|
200 square feet per job
|
72.6
|
51.9
|
32.5
|
|
175 square feet per job
|
65.3
|
47.2
|
30.3
|
|
SOURCE: Moody’s Analytics
Independent Budget Office
|
In the midrange estimate, in which
employment grows at roughly the historical average growth
rate of 0.5 percent each year and companies provide an
average of 200 square feet per worker, we estimate that
there will be demand for 52 million square feet of space, a
figure which includes the need to replace 20 million square
feet of space lost to conversions and demolitions. However,
the range of scenarios puts the demand for office space
through 2040 resulting from office-using employment growth
as high as 87 million square feet or as low as 30 million
square feet.
The considerable uncertainty in
these results shows how sensitive the long-term demand for
office space is to small changes in assumptions about the
employment growth rate or the amount of space that
businesses allocate per worker. If space utilization rates
and conversion activity are held constant, reducing the
average annual growth rate from 0.75 percent growth to 0.5
percent growth would cut the total demand for office space
by about 30 percent. If office employment only rises by an
average of 0.25 percent, demand would fall by as much as 57
percent as compared with the 0.75 percent growth scenario.
Similar reductions would occur if
companies decide to allocate less space per worker. Holding
employment growth and conversions constant, every 25 square
foot reduction in the space needed per worker decreases the
total demand for net new office space by 6 percent to 10
percent.
The 2011 Cushman & Wakefield study
projected that the city would need an additional 92 million
square feet of office space by 2040. While that amount is
similar to IBO’s most optimistic scenario, it is nearly 80
percent higher than our midrange estimate. That demand
estimate could prove to be overly optimistic should
employment growth prove sluggish or if employers continue to
shrink the amount of space they allocate per worker.
|
Cushman & Wakefield Office
Forecast Methodology
|
|
The real estate firm of Cushman &
Wakefield published long-term forecasts of Manhattan’s
office, hotel, residential, and retail markets as part of
the city’s due diligence for the 2006 and 2012 Hudson Yards
bond offerings. The city justified the need for the rezoning
of the Far West Side in part based on the gap that the firm
found between future demand for office space and available
supply under existing zoning regulations.
In its 2012 report, Cushman &
Wakefield estimated that office-using employment growth
would generate demand for 91.9 million square feet of office
space in Manhattan through 2041, including 48.6 million
square feet in Midtown, 25.3 million square feet in Hudson
Yards and 18 million square feet Downtown. This dramatically
exceeded the 43 million square feet of office space that
could be accommodated by Manhattan’s existing development
sites, based on then-current zoning regulations. According
to this market analysis, the rezoning of Hudson Yards would
capture a significant share of this potentially unmet demand
without negatively affecting Manhattan’s other commercial
districts.
Cushman & Wakefield arrived at its demand estimate based
on a regional forecast of the office-using employment
developed by Moody’s Analytics. The report notes that, after
taking into account job gains and losses over multiple
recessions, office-using employment in the region would grow
at an average annual rate 0.7 percent, while employment in
the city would grow at an average annual rate of 0.77
percent through 2041. Cushman & Wakefield then translated
employment growth into the regional demand for office space,
which was divided among the six regional submarkets, using a
series of regression models based on the historical
relationship between employment growth and the net
absorption of office space dating back to 1986. Their model
considers other factors as well, including the destruction
of the World Trade Center in 2001 and year-to-year changes
in the availability of incentives offered by different local
governments, the cost of capital, and each market’s share of
occupied office space in the region.
|
Forecasting Supply of New Office Development
Given our forecast of demand for
new office space, we now turn our attention to projecting
the future supply of office buildings that will be available
to meet that demand. IBO considers new buildings currently
under construction, office conversion projects and publicly
known development sites located throughout the city, as well
as new capacity that could be added in East Midtown. IBO
projects that current development capacity is about 44
million square feet, increasing to 48 million if the East
Midtown rezoning is approved.
|
New Office Construction Primarily in World Trade Center and
Hudson Yards
In
millions of square feet
|
|
Property
|
Total Size
|
Available Space
|
|
1 World Trade Center
|
3.0
|
1.3
|
|
4 World Trade Center
|
2.3
|
1.1
|
|
Hudson Yards South Tower
|
1.7
|
0.5
|
|
250 West 55th St
|
0.9
|
0.4
|
|
7 Bryant Park
|
0.4
|
0.4
|
|
51 Astor Place
|
0.3
|
0.3
|
|
330 Hudson Street
|
0.3
|
0.3
|
|
1000 Dean Street
|
0.1
|
0.1
|
|
TOTAL
|
9.0
|
4.4
|
|
NOTE: Only includes projects of at least 100,000 square feet.
Independent Budget Office
|
Projects in Construction.
There is 4.4 million square feet of
office space available to lease in buildings currently under
construction. The majority of this space is located in the 1
and 4 World Trade Center buildings, which, when completed,
will add to the Downtown market more than 5 million square
feet, of which 2.9 million square feet has already been
leased. The next largest building is a 1.7 million square
foot tower—three-quarters of which has been leased or sold
to tenants—that the Related Companies is currently building
in Hudson Yards. The remaining buildings are boutique office
buildings of less than a million square feet, most of which
are less than 500,000 square feet. One current conversion
project, located at 1000 Dean Street in the Crown Heights
neighborhood of Brooklyn, is transforming a former auto
garage and warehouse into shared office space. Though we
have only identified projects of at least 100,000 square
feet, there are also a number of small office projects under
construction in the Soho, Meatpacking, and Far West Chelsea
neighborhoods.
Development
Sites.
There are also a number of potential
development sites throughout the city that could accommodate
office projects in the future.
In the 2012
Hudson Yards bond offering, Cushman & Wakefield identified
19 locations outside of Hudson Yards that, based on
then-current zoning regulations, could potentially
accommodate new office buildings.7 IBO reviewed
the current status of these sites. Since the report was
published, three of the largest sites—the Hotel
Pennsylvania, 701 7th Avenue, and 221-225 West
57th Street—saw their developers opt to build (or preserve)
hotel, retail, or residential space rather than office
space. A fourth, the Port Authority Bus Terminal, stalled
after the authority failed to reach an agreement with its
development partner to build a tower over the bus station.
Five of the sites are under construction and were included
in our list of construction sites. The remaining sites
identified by Cushman & Wakefield are in our list of
potential development sites, including the stalled project
at the bus terminal.
Five other sites have been
proposed since the time of the Cushman & Wakefield report:
the sites assembled by SL Green at the corner of East 42nd
Street and Madison Avenue; 425 Park Avenue; a lumberyard on
9th Avenue and West 15th Street; the conversion of the
Domino Sugar Factory in Williamsburg, Brooklyn; and the
conversion of the Watchtower properties in DUMBO. Under
current zoning, the owners of the two East Midtown sites can
rebuild only the amount of office space currently located on
those properties. Since neither would add net new square
footage, we have excluded them from this analysis.
|
Far West Side Home to Most of Manhattan’s
Remaining Development Sites
In millions of square feet
|
|
Site
|
Net New Space
|
|
Announced Hudson Yards Sites
|
12.3
|
|
Potential Hudson Yards Sites
|
11.3
|
|
3 World Trade Center
|
2.8
|
|
2 World Trade Center
|
2.3
|
|
20 Times Square (Port Authority Bus Terminal)
|
1.5
|
|
45 East 45th Street (Roosevelt Hotel)
|
1.2
|
|
Watchtower Properties (Multiple Sites, Brooklyn)
|
1.2
|
|
304-322 Hudson Street (4 Hudson Square)
|
0.8
|
|
708 1st Avenue (Solow Site)
|
0.9
|
|
740 8th Avenue
|
0.9
|
|
292-314 Kent Avenue
(Domino Sugar
Refinery, Brooklyn)
|
0.6
|
|
341-347 Madison Avenue (MTA Headquarters)
|
0.3
|
|
75 9th Avenue (Chelsea Market)
|
0.3
|
|
61 9th Avenue (Prince Lumber)
|
0.2
|
|
TOTAL
|
36.6
|
|
SOURCE: Cushman & Wakefield
NOTE: For development sites in the proposed East
Midtown rezoning area, net new development potential
reported here is the difference between maximum
density allowed under current zoning and the
existing gross square footage on those sites.
Properties listed include only projects of at least
100,000 square feet of net new office space.
Independent Budget
Office
|
Approximately two-thirds of the
total potential office capacity is located in the Hudson
Yards district. Developers active in the Far West Side are
currently seeking tenants and financing for several towers
totaling 12.3 million square feet, while an additional 11.3
million square feet of development rights exist elsewhere in
the area. The Related Companies has reportedly reached an
agreement with Time Warner to occupy at least a portion of
its North Tower in the Hudson Yards project.
Outside Hudson Yards, there are
approximately 11.2 million square feet of potential net new
office development rights in Manhattan. Two of these
sites—the Roosevelt Hotel and the Metropolitan
Transportation Authority’s headquarters—are in the East
Midtown area proposed for rezoning; together they can
accommodate 1.5 million square feet of new office space
under current zoning regulations. Silverstein Properties is
seeking tenants for about 5 million square feet of space at
the 2 and 3 World Trade Center buildings. The firm is
currently building the foundations and street-level podiums
at both sites. Its financial backers, including the city and
state, have required Silverstein to reach specific office
leasing milestones before it can begin building the office
towers on each site. According to recent reports,
Silverstein has signed a letter of intent with a tenant to
lease a portion of 3 World Trade Center.8
Two portfolios in Brooklyn—the
Domino Sugar Refinery in Williamsburg and the Jehovah’s
Witnesses’ Watchtower properties in DUMBO—were recently sold
to developers that intend to convert at least some of the
properties from industrial uses to office space. Together,
the two projects could add as much as 1.8 million square
feet of new office space.
Additional
Capacity in Brooklyn and Queens.
The rezonings of Downtown Brooklyn,
Atlantic Yards, Long Island City, and Jamaica collectively
included the potential for nearly 12 million square feet of
office space. These rezoning initiatives reflect the efforts
of multiple mayoral administrations to expand the city’s
central business district into the other boroughs.
In the years since the plans were
approved, residential properties have accounted for nearly
all new development in those areas, though there remains
additional capacity should a market develop for modern
office space in the other boroughs. Since 2006, developers
have built three new build-to-suit office buildings totaling
1.4 million square feet in Long Island City, though no new
projects are proceeding there at the moment.
Since a detailed site-by-site
review of these areas was beyond the scope of this paper,
IBO instead assumed that one-quarter of the nearly 12
million square feet of development rights created in the
rezonings are still unused, which would translate into as
much as 2.9 million square feet of office space that could
be built in Brooklyn and Queens.
Citywide Capacity. Including
the 4.4 million square feet of office space that is still
available in sites currently under construction and the
potential for an additional 2.9 million square feet in
Brooklyn and Queens, the total amount of new development
capacity at known sites under existing zoning regulations is
nearly 44 million square feet.
Not all of these sites will
ultimately be developed as office buildings. The fact that a
site is zoned for office development does not guarantee that
its owner will ultimately build new office space,
particularly if there is little demand in that location or
if there is a "higher and better use" for the land. As
noted, the owners of several sites in Downtown Brooklyn and
Midtown West have opted to build residential or hotel
projects instead of office buildings in locations where the
zoning rules allowed either use.
East Midtown Rezoning.
The proposed rezoning of East Midtown
would come on top of the nearly 44 million square feet that
is either currently under construction or could be built in
other areas of the city.
The
Department of City Planning estimates that East Midtown
rezoning would allow from 8.2 million square feet up to 10.3
million square feet of office development over 20 years, of
which as much as 3.7 million square feet would be net new
space. If the East Midtown rezoning is approved, the
development capacity citywide would rise to 47.5 million
square feet of office space.9
In the aggregate, the rezoning
would need to capture only a small share of the citywide
demand for office space to be successful. The plan’s
proposed 3.7 million square feet of net new office space
represents only 10 percent of demand in IBO’s midrange
forecast through 2033 and 7 percent through 2040.
The rezoning’s small share of
overall demand does not, however, mean that development in
East Midtown will happen before or at the expense of
projects in Hudson Yards and the World Trade Center. The
city’s various office submarkets offer tenants different
amenities, floor plates, levels of transit accessibility and
price points. The proposed East Midtown projects might
appeal to a different set of tenants than would be willing
to move to the Far West Side or Downtown, and vice versa.
Properties in the Hudson Yards financing district and in the
World Trade Center also offer tax incentives that are not
available to tenants and building owners in East Midtown.
Cushman & Wakefield Projection.
The city planning department’s justification for the
East Midtown proposal relies in part on the office demand
estimates that Cushman & Wakefield produced for the 2012
Hudson Yards bond offering. At that time, Cushman &
Wakefield projected that demand for new office space in
Manhattan would total nearly 92 million square feet over the
next 30 years. Even after accounting for the 25 million
square feet of space that they predicted could be
accommodated in Hudson Yards, Cushman & Wakefield found that
there would be a 20 million square foot shortfall between
potential demand and what could be met by the market. City
planning argues that the 3.7 million square feet of new
office space in East Midtown would help to address some of
that potential shortfall.
Based on our analysis, it appears
that Cushman & Wakefield’s estimate may prove to be overly
optimistic. Cushman & Wakefield’s model is based primarily
on the historical relationship between employment growth and
the net absorption of office space, dating back to 1986.
By relying on a series of
regression models that assume a consistent relationship
between employment growth and net absorption, the firm
assumes that businesses’ demand for office space in the
future will respond to changes in economic conditions in
much the same way as in the past. In reality, the office
market has evolved over time—and continues to evolve—based
on the changing needs of tenants. Many of the companies that
absorbed the hundreds of millions of square feet built
across the region during the 1980s and 1990s now appear to
be cutting jobs or reassessing their space needs. Employment
among the financial and law firms that filled developments
like the World Financial Center in the 1980s and 1990s has
been flat since at least 2000, while vacancy rates in
suburban markets now approach or exceed 20 percent.10
The approach also does not
acknowledge the impacts of the ongoing diversification of
New York City’s economy. In the current recovery, growth
among office-using industries has been concentrated in
media, technology, advertising, and design, all of which
have different real estate needs than the companies in
finance, insurance, or legal services that drove earlier
expansions in the city. These businesses also occupy less
space per worker and employ fewer workers relative to large
firms with comparable levels of revenue in other sectors or
to large firms in prior decades.
The Cushman & Wakefield model uses
an employment forecast from Moody’s Analytics that is
aggressive based on historical trends. Its average annual
growth rate of 0.77 percent is higher than the peak-to-peak
average growth rate for office-using employment during any
single economic cycle dating back to 1969. Though Cushman &
Wakefield notes that this growth is comparable to growth
during the recovery from 2003 through 2008, it may overstate
average annual growth through multiple cycles of expansion
and contraction. While it is possible that the strong
employment growth during the current recovery will prove to
be sustainable, we consider it unlikely that the
office-using job market will outperform its historical
average for the next 30 years.
|
Demand Will Likely Match Supply In Baseline Growth Forecast
|
|
IBO Supply Forecast
|
Millions of Square Feet
|
|
Under Construction, Not Yet Leased
|
4.4
|
|
Potential Development Sites
|
36.6
|
|
Additional Capacity in Outer Boroughs
|
2.9
|
|
Subtotal, Capacity under Existing Zoning
|
43.8
|
|
Additional Capacity in Proposed
Midtown East
Rezoning
|
3.7
|
|
TOTAL, Existing and Proposed Capacity
|
47.5
|
|
IBO Demand Forecasts
|
|
|
Baseline Scenario: Growth of 0.5 percent a year,
200 square feet per worker
|
51.9
|
|
Other Scenarios
|
|
|
Growth of 0.75 percent a year,
250 square feet per worker
|
87.1
|
|
Growth of 0.75 percent a year,
175 square feet per worker
|
65.3
|
|
Growth of 0.5 percent a year,
250 square feet per worker
|
61.3
|
|
Growth of 0.5 percent a year,
175 square feet per worker
|
47.2
|
|
Growth of 0.25 percent a year,
250 square feet per worker
|
37.1
|
|
Growth of 0.25 percent a year,
175 square feet per worker
|
30.3
|
|
Cushman & Wakefield Demand Forecast
|
|
|
2011 Demand Forecast (Manhattan Only)
|
92.0
|
|
SOURCES: Cushman & Wakefield
NOTE: Totals may not add due to
rounding.
Independent Budget Office
|
Conclusion
IBO’s midrange estimate of demand
for office space, 51.9 million square feet through 2040, is
close to our estimate of citywide supply, which we expect to
rise to 47.5 million square feet after the proposed rezoning
of East Midtown. While our forecast is lower than that of
Cushman & Wakefield, it nonetheless suggests that there will
likely be enough demand over the next 30 years to support
the full build out of the World Trade Center, Hudson Yards,
and East Midtown, in addition to other sites in Manhattan,
Brooklyn, and Queens.
The wide range of potential
outcomes surrounding our midrange forecast, however,
highlights the considerable uncertainty involved in office
market forecasting over a 28 year time frame. Our model
illustrates how small changes in the rate of growth in
office-using employment and the space utilization rate can
significantly affect the demand for new office space.
Depending on how these rates change over time, demand for
office space in 2040 could be as little as 30 million square
feet or as much as 87 million square feet. Future shifts in
policy and structural change in the economy may also affect
the demand for space.
Even if the demand for office
space is at the low end of the range of estimates, the city
may still have legitimate reasons for wanting to rezone East
Midtown. If the neighborhood’s existing zoning constraints
discourage landlords from reinvesting in the Grand Central
area, then the rezoning could help satisfy a pent-up demand
for new office space in the area. The additional supply
could also make office rents more affordable citywide.
The District Improvement Fund plan
calls for the city to sell incremental development rights
and to spend the proceeds on pedestrian and subway
improvements in East Midtown. We have not taken a position
on the merits of these capital projects. The uncertainty in
our office market forecast, however, suggests that funding
capital projects with DIF revenue is not a risk-free
proposition. If DIF funds are used on a pay-as-you-go basis,
the plan would make high-priority capital projects dependent
on a volatile revenue stream that offers little certainty
about how much and on what schedule money will be available.
If the funds are used to reimburse upfront investments, the
city could be responsible for debt service payments on the
improvements for an unforeseeable period of time.
This report prepared by Sean
Campion
Endnotes
1
In both the 2004 report and
the current update, the terms "demand" and "supply" simply
refer to a quantity of space, regardless of price.
2
The "Midtown Development"
report is available on the city planning Web site here:
http://www.nyc.gov/html/dcp/pdf/history_project/midtown_development.pdf.
Other studies on the Special Midtown District proposal can
be found on the department’s History Project page:
http://www.nyc.gov/html/dcp/html/history_project/history_project_east_midtown.shtml
3Data
on employment is from Moody’s Analytics’ employment
database, which covers major industry sectors from 1970
through 2012. The sectors included in our definition of
office-using employment roughly correspond to the following
two-digit NAICS sectors: Information (51), Finance and
Insurance (52), Real Estate Rental and Leasing (53),
Professional, Scientific and Technical Services (54),
Management of Companies and Enterprises (55) and
Administrative and Support Services (56). Moody’s data
bridges between the current NAICS system and the previous
classification systems, dating back to 1970.
These
industries are surrogates for office-using employment. Not
all jobs in finance, information, or professional services
are located in offices. Conversely, the definition does not
capture the share of workers in other industries who work in
offices. For example, the corporate headquarters of a retail
company located in New York City contributes to the demand
for office space, even though it is classified in the retail
sector.
4
See:
http://www.costar.com/News/Article/Changing-Office-Trends-Hold-Major-Implications-for-Future-Office-Demand/146580
and
http://www.nytimes.com/2013/02/19/business/hotels-carve-out-work-spaces-rented-hourly.html?pagewanted=2&_r=0.
5
Estimates for New York
City’s natural office vacancy rate have varied in different
studies, though most studies have found that the natural
rate in cities with significant barriers to development,
like New York, Boston, or San Francisco, is around 7 percent
to 8 percent. See:
http://www.phil.frb.org/research-and-data/publications/business-review/1989/brmj89tc.pdf
or
http://www.frbsf.org/economic-research/publications/economic-letter/2001/october/natural-vacancy-rates-in-commercial-real-estate-markets/.
6
The vacancy rate is for
Class A, B, and C office buildings in Manhattan’s Midtown,
Midtown South and Downtown office markets.
7
Cushman & Wakefield counted
2, 3, and 5 World Trade Center buildings as one development
site. It did not list 1 or 4 World Trade Center, since those
buildings were already under construction at the time of
that report.
8
See
http://www.nypost.com/p/news/business/groupm_signs_huge_year_lease_at_fOVuM7Z3GKlCuUUL1x9kVI
9
City planning has not
estimated the amount of net new office space that could be
built under on the revised zoning text amendment, which
allows developers to devote as much as 20 percent of the
floor area of office buildings to residential space or
hotels. The 3.7 million square foot estimate is based on
data from the original draft Environmental Impact Statement.
10
Partly in response to these trends, the current
owner of the World Financial Center recently rebranded the
development as Brookfield Place in order to attract tenants
besides financial firms.
PDF version available
here
Receive
notification of free reports by e-mail
Facebook
Twitter
RSS