Introduction
Like all infrastructure, New York City’s bridges require high levels of investment in order to achieve and maintain a state of good repair. Deferred maintenance and inadequate capital expenditures in the wake of the city’s fiscal crisis of the 1970s led to a deterioration in overall bridge condition. By the 1990s a major reconstruction program had begun, but according to the city’s Department of Transportation (DOT), in 1996 there were still 48 bridges (6.2 percent of the total) in poor condition, including the main Brooklyn Bridge structure and the Williamsburg Bridge.
In 1998 the New York City Comptroller published a report on the city’s infrastructure, Dilemma in the Millennium, which estimated that an investment of $5.3 billion (constant 1998 dollars) would be required over the next decade to bring the city’s bridges to a state of good repair.1 In the Bridges and Tunnels Annual Condition Report for 2011, then-DOT Commissioner Janette Sadik-Khan wrote, “We now have a robust capital bridge program and have seen significant improvement in bridge conditions Citywide.” The Commissioner went on to say, “This kind of spending helped reduce the number of bridges rated poor from seventy-four —25 years ago—to just three today, all of which are now undergoing rehabilitation.”2 By the following year DOT could report that just one city bridge—the Brooklyn Bridge—was still in poor condition.
Capital commitments on all the city’s bridges from 2000 through 2012 totaled around $4.2 billion in constant 1998 dollars.3 While the average condition for all bridges under city jurisdiction, weighted by bridge size, rose from 4.28 to 4.62 during that period (the higher the score the better the condition), it still fell short of 5.0, the state transportation department’s threshold for a bridge not to be classified as deficient.
In this report, IBO looks at how the city’s capital investment in bridges over the 13-year period of 2000-2012 is related to the condition ratings of the bridges.4 For 209 bridges with identifiable capital investment during the study period, IBO determined the condition of the bridges in 1999 and tracked how changes in condition occurring from 2000 through 2012 were related to capital spending during the same period. The main research questions were:
-
What is the relationship between capital spending and improvements in bridge condition?
-
Did bridges in worse condition receive relatively more capital spending than other bridges in 2000 through 2012?
-
Did bridges in the worst condition early in the period receive capital spending sooner than other bridges?
-
Does it cost more to raise the rating of a bridge when its initial condition is better? In other words, is bridge condition rating quality subject to increasing marginal cost?
-
Based on recent trends, will continued high levels of spending be necessary to maintain bridge quality?
The Bridges of New York City
The transportation department is responsible for the repair and maintenance of nearly 800 bridges in the city, all of which are untolled. These structures range in size from pedestrian crossings with a few hundred square feet of deck space to the gigantic East River bridges, two of which—the Ed Koch Queensboro and the Manhattan—each have over 1 million square feet of deck space.
In addition to the DOT bridges, there are more than 600 bridges in the city under the jurisdiction of the New York State Department of Transportation (NYSDOT). Maintenance for eight of these bridges, including the Macombs Dam Bridge in the Bronx, is shared with the city, while the rest are maintained fully by the state. There are seven bridges and two tunnels in the city operated by the Metropolitan Transportation Authority, and three bridges and two tunnels operated by the Port Authority of New York and New Jersey This paper focuses only on bridges maintained by DOT; maintenance of the remaining state bridges is funded through the state budget, and maintenance of facilities run by the two authorities is self-financed by those agencies through tolls.
City spending on bridges comes through both the operating and capital budgets. Day-to-day operations and routine maintenance and repairs are paid from the operating budget, while major repairs and renovations are paid out of the capital budget. From 2010 through 2012, DOT averaged around $58 million per year in operating budget expenditures for bridge maintenance, repair, and operations, and an additional $26 million per year for bridge engineering and administration.
Capital spending is generally financed through borrowing, and the debt service on outstanding bonds is paid from the city’s operating budget. These capital expenses are accounted for at the city level, rather than within individual department budgets. The level of capital investment in bridges can be measured by either commitments or expenditures. Capital commitments reflect the estimated cost of a project at the time the contact is registered, while expenditures indicate actual cash outlays in a given year. Capital commitments for bridge projects averaged $512 million a year from 2010 through 2012, while actual capital expenditures averaged $556 million a year. Most of the commitments ($1.2 billion out of a $1.5 billion total) were made in 2010, due to an influx of federal stimulus funds that year. Capital commitments can vary widely from year to year because of the timing of contracts, while actual capital expenditures, reflecting cash spent for capital projects committed in that year or previously, are usually less volatile.
Bridge Condition Ratings. The New York State Department of Transportation is responsible for inspection of the city’s bridge structures, with the exception of pedestrian bridges and structures less than 20 feet in length, which are inspected by the city’s transportation department.5 The table below summarizes the bridge rating systems used by the state and city. The state rates bridges—and their approaches—on a numerical scale from 1 (structural failure) through 7 (new). City DOT characterizes the overall rating for a bridge structure as an average of the ratings for 13 individual components, each of which can be weighted differently, with the inspector given discretion on assigning specific weights. The state’s Bridge Inspection Manual describes the formulation of an overall rating as a process involving the judgment of the inspection team rather than a precise mathematical formula. The Manual recommends giving the greatest weight in the overall rating (around 39 percent) to the pier, i.e., the supporting elements under the bridge. The suggested weight for the deck elements, including the roadway, is only 6 percent, Because the overall condition of a bridge involves multiple facets of the structure, a bridge rated at 4.0 will likely have some components rated at 3.0 (serious deterioration/not functioning as originally designed) or lower.6
The city rates bridges using four categories, each of which corresponds to a specific range of state numerical ratings. Bridges in poor condition are those with state numerical scores from 1.000 through 3.000. Fair bridges score from 3.001 through 4.999, good bridges from 5.000 through 6.000, and very good bridges from 6.001 through 7.000.
|
State and City Ratings of Bridge Condition |
||||
|
State
Numerical Rating |
State Rating Description |
City Rating |
IBO Rating for This Report |
|
|
1.000 |
Totally
deteriorated, or in failed condition |
Poor |
Poor |
|
|
2.000 |
Used to shade
between 1 and 3 |
Poor (1.000-3.000) |
Poor |
|
|
3.000 |
Serious
deterioration, or not functioning as originally
designed |
Fair (3.001-4.999) |
Fair Low |
|
|
4.000 |
Used to shade
rating between 3 and 5. State DOT defines a
“deficient” bridge as one with a state condition
rating less than 5.0. |
Fair (3.001-4.999) |
Fair High |
|
|
5.000 |
Minor
deterioration, and is functioning as originally
designed |
Good (5.000-6.000) |
Good |
|
|
6.000 |
Used to shade
rating between 5 and 7 |
Very Good
(6.001-7.000) |
Very Good |
|
|
7.000 |
New condition |
Very Good |
Very Good |
|
|
SOURCES: New York
City Department of Transportation; New York State
Department of Transportation
New York City
Independent Budget Office |
||||
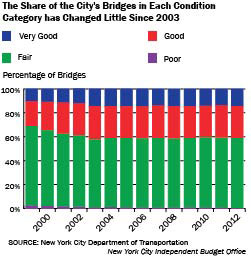
From 1999 through 2003, the share
of bridges in poor or fair condition dropped from 68 percent
to 57 percent. There was a corresponding increase in the
share of bridges in good or very good condition, from 32
percent to 43 percent. Since 2003 the share of bridges in
each of the city’s categories has remained roughly constant,
with less than 1 percent in poor condition.
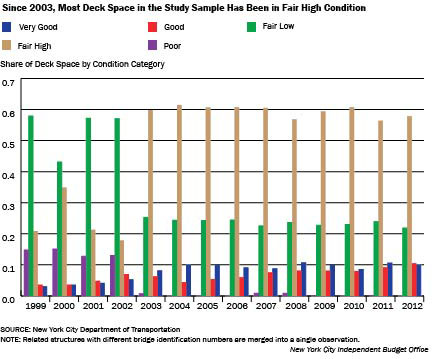
The above analysis gives an equal weight to each bridge, independent of its size. When average bridge quality is calculated weighting each bridge or group of related bridge structures (i.e. the actual span plus approaches) by platform area of the structure or structures (what is known as “deck space”), the improvement over time is more dramatic.7 In 1999, almost 13 percent of total bridge deck space was in poor condition, including all or part of the Macombs Dam, Brooklyn, and Williamsburg bridges. Since 2003, the share of deck space in poor condition has varied between 1 percent and 4 percent. In 2012, the only bridge in the city’s inventory in poor condition was the Brooklyn Bridge.8 This bridge is currently undergoing a major rehabilitation of its approaches, as well as a painting of the entire structure.
Data and Methodology
This study relied on two data sources: the DOT’s bridge database and the city’s Financial Management System. The bridge database provides descriptive information on the bridges and their condition ratings, while the Financial Management System provides data on capital commitments and expenditures. The study uses data for the years 1999 through 2012.
Bridge Database. The bridge database includes a bridge identification number for each structure, including approaches and spans, the borough where it is located, the streets carried and crossed by the bridge, the amount of deck space, and numerical and categorical condition ratings. Since roughly 60 percent of bridges fall into the fair category, IBO subdivides the group into two categories—bridges rated from 3.001 through 4.000 on the state scale are labeled fair low, while structures rated from 4.001 through 4.999 are labeled fair high—in order to provide more detail on the condition of these bridges.
During the study period, the number of bridges under DOT’s jurisdiction grew from 764 to 787. This total includes culverts that channel water under roads and rail lines and a number of other small structures that are not easily recognizable as bridges. In addition, the inventory counts a number of bridges that are actually approaches to or levels of larger structures.9 The Brooklyn Bridge, Manhattan Bridge, Ed Koch Queensboro Bridge, Willis Avenue Bridge, Third Avenue Bridge, Madison Avenue Bridge, and a few other smaller bridges consist of two or more structures, each with a separate identification number. In these cases, IBO combined the related data into one observation and calculated a new bridge rating that is an average of the individual structure ratings, weighted by the deck area (i.e., the surface area) of each structure. When merged with capital spending data, the resulting database included 236 separate structures (out of the 787 in the 2012 inventory), combined to make a data set of 209 bridges.
Capital Spending Data. IBO identified dedicated capital spending for the 209 different bridges from 2000 through 2012. Commitments and expenditures are reported in constant 2012 dollars, calculated using the Rider Levett Bucknall (RLB) index for construction costs.10
During the boom years leading up to the financial crisis of 2008, construction activity in the city was subject to large annual increases in material and labor costs. As a result, the amount of money required to do a given amount of work on the city’s bridges rose substantially. For example, MEPS, a steel sector consulting company, estimated that U.S. steel prices rose about one-third between January 2007 and March 2008. The intense level of construction activity during the boom also led to shortages of construction workers and upward pressure on wages. According to the RLB quarterly cost index, construction costs in New York City peaked in the fourth quarter of 2008, just after the financial crisis came to a head. Costs declined over the next five quarters, and then remained relatively flat until mid-2011. As of April 2013, costs were still slightly below their 2008 peak, according to the RLB index.
Some capital spending on bridges is excluded from the study because it was not possible to associate the funding with a specific bridge. Even though multiple bridge capital projects were excluded, the study captures most of DOT’s larger bridges (including all of the large river crossings) and the overwhelming majority of bridge capital spending. While the bridges in our study represent just over 30 percent of the total number of structures in DOT’s bridge inventory, they represent nearly three-fifths of the total deck area, and almost 90 percent of all bridge capital spending.
Capital spending can be measured either in terms of capital commitments or capital expenditures.11 A capital commitment occurs when the City Comptroller registers a contract to construct or purchase a capital asset and the full contract amount is registered in that year, even though spending (the capital expenditure) typically takes place over multiple years. This report uses both measures, depending on the context. Expenditures usually give a more accurate picture of work actually done in a particular year, whereas commitments give a clearer view of the city’s investment priorities. The expenditures referred to in this paper are “liquidated expenditures,” which means that the city has recorded the payment in its books.
|
The Bridges in
the Study Account for Most of the City’s Capital
Spending on Bridges |
|||
|
|
Bridges in Study |
All Bridges in DOT Inventory |
Bridges in Study as % Of all DOT Bridges |
|
Number of Bridges |
236 spans combined
into 209 bridges |
787 |
29.9% of the 787
spans |
|
Deck Area,
Millions of Sq. ft. |
8.3 |
14.5 |
57.3% |
|
Capital Commitments 2000-2012,
Constant 2012 dollars in billions |
$6.1 |
6.9 |
89.5% |
|
Liquidated Capital Expenditures 2000-2012,
Constant 2012 dollars in billions |
$4.7 |
5.2 |
89.3% |
|
SOURCE: New York City Department of Transportation
NOTE: The Department of Transportation inventory
includes some individual structures that IBO has
merged together into one observation.
New York City
Independent Budget Office |
|||
Capital Spending and Bridge Condition
In looking at capital commitments and bridge condition ratings, one general concern is whether DOT is pursuing an efficient capital spending strategy. Such a strategy would initially target capital commitments to bridges in worse condition, i.e., with lower bridge condition ratings. As average bridge condition improves over time, however, the cost of increasing condition ratings by a given amount will likely rise.12
Improving Bridge Condition Ratings. The average condition of the 209 bridges in the study improved over the period of 2000-2012, with most of the increase in condition ratings coming in the years 2000-2003. The chart on this page presents the shares of bridge deck area (rather than share of bridges as before) in each condition class. The most notable trends are the sharp decline in bridge area in poor condition, the significant movement of bridge ratings over time from fair low to fair high, and the proportionally large increase in the share of bridge area in good or very good condition.13 There were no bridges in IBO’s data set that were in poor condition in 2012. While the city rated the main span of the Brooklyn Bridge as being in poor condition, the average condition of this bridge when combined with its approaches was fair low.
The Big Picture: Capital Spending and Improvement in Bridge Condition. Capital expenditures on the bridges in the study averaged around $360 million per year in constant 2012 dollars from 2000 through 2012, and average bridge condition, weighted by deck area, rose from 3.85 to 4.54 over this period.14 The correlation (a measure of the relationship between the values of two variables) between spending on individual bridges and the change in their condition rating from 2000 through 2012 was relatively strong and positive (r=.24), and statistically significant at the .01 level. The correlation between capital commitments and the change in rating was somewhat weaker, at 0.14, and was significant at the .05 level. In both cases, observations were weighted by the size (deck area) of the bridge.
While the data show an overall
positive relationship between the total amount of capital
commitments and spending in 2000-2012, and the improvement
in bridge condition over the same time span, a breakdown by
sub-period shows that the increase in average condition
rating largely took place in (calendar) years 2000-2003, a
period in which capital spending was relatively low compared
with later years, but increasing rapidly. Capital spending
was highest in fiscal years 2004, 2005, and 2009 through
2012.

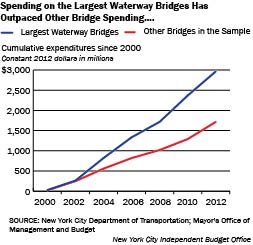
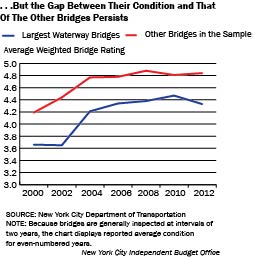
A comparison between the 10 largest waterway bridges (the four East River crossings plus six Harlem River bridges) and the rest of the structures in the study shows that while the largest waterway bridges have consistently lower ratings than the others in the study, significant investment narrowed the gap by 2010. Between 2010 and 2012 the gap widened slightly, despite continued heavy spending on the waterway bridges. Overall, roughly 63 percent of the capital spending on the bridges in the study went to the group of 10 bridges, somewhat higher than their 57 percent share of deck space. (IBO compared cumulative expenditures and average bridge condition at two-year intervals because bridges are generally inspected every two years, making year-over-year change in condition misleading.)
Which Bridges Received Funding? It makes both economic and engineering sense for DOT to initially target those bridges that are in worst condition. The lowest-rated bridges may present a danger to users, or at a minimum, provide a sub-optimum travel experience. Moreover, neglecting those bridges in the worst shape could potentially push the structure to a point where replacement makes more sense than repair.
IBO found that bridges with lower initial ratings received more funding than bridges that were rated higher at the beginning of the study period. There was a statistically significant negative relationship between the initial 2000 bridge ratings and both capital commitments and liquidations for the period 2000-2012.15
A related question is whether high-need bridges received funding sooner than other bridges. To answer this question, IBO divided the period under study into three sub-periods: 2000-2003, 2004-2007, and 2008-2012 and added up commitments for bridges rated poor, fair low, fair high, good, and very good in 2000. The data show that during the earliest period (2000-2003), commitments were concentrated on the bridges that were in the two lowest condition categories.
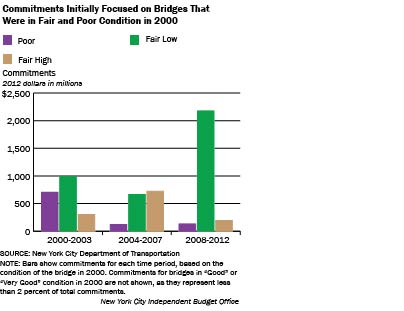
Bridges initially in poor
condition, which comprised 15 percent of total deck area in
the data set, received 35 percent of all commitments, and
bridges in fair low condition, with 43 percent of total deck
area, received 49 percent of commitments.
Commitments for bridges initially in poor condition dropped
off sharply in 2004-2007 and remained low in 2008-2012, as
the initial (2000-2003) commitments moved these bridges
toward a state of good repair. As noted earlier, by calendar
year 2003 poor bridges had practically disappeared from the
group of bridges in the study. Commitments in 2004-2007 were
split fairly evenly between bridges that were in fair low
condition in 2000 (44 percent), and those that were
initially in fair high condition (47 percent). Finally, in
2008-2012 the overwhelming share of commitments (86 percent)
was for bridges that were in fair low condition in 2000.
Over half of these commitments were for the Willis Avenue
and Brooklyn Bridges, which had not received significant
commitments earlier in the decade. The Willis Avenue project
involved replacing the existing bridge with a new structure
that opened in October 2010 (fiscal year 2011).16
IBO’s analysis focuses on commitments as a function of initial (2000) bridge condition, and does not explore the impact that subsequent declines in condition could have on commitments. All structures experience a gradual deterioration over time, but in addition bridges may suddenly develop serious deficiencies that require immediate attention. The resulting capital commitments would be unrelated to the bridge’s initial condition. IBO found only a few cases in which bridges experienced a sudden drop in condition, all of which involved relatively small structures (less than 10,000 square feet of deck space).17
The Incremental Cost
of Bridge Improvements. Numerical bridge
ratings are based on an ordinal, not cardinal, scale. While
a higher rating signifies better condition, there is no
objective basis for saying that a rating increase from 2.0
to 4.0 represents more, less, or the same amount of
improvement as an increase from 4.0 to 6.0. However, if the
city’s goal is for bridge ratings to continue to improve
over time, it is useful to have some notion of how much
spending will be required to achieve a given rating
increase.
IBO found that while the cost of improving bridge ratings
varied considerably from bridge to bridge and from year to
year, generally more investment was required to raise
condition from fair high (4) to good (5), than from poor (2)
to fair low (3). In other words, adjusting for bridge size,
a dollar spent on a poor bridge improved condition ratings
more than a dollar spent on a fair high bridge.
Forward, Backward, or Standing Still: Will Bridge Condition Improve Further?
While the city has continued to spend hundreds of millions of dollars each year on bridge capital projects, by some measures, average bridge condition has changed little since 2003. Even though each of the 209 bridges in our study received some capital investment during 2000 through 2012 and over half had liquidated expenditures greater than $1 million, almost 42 percent of the bridges, representing around one-third of the total deck area in the study, had a lower condition rating in 2012 than in 2000.
The median decline was only 0.22 on the 7-point scale, and only six bridges experienced a decline of great than 1.0.18 In most cases of rating declines, the drop-off was very small, less than 0.22 on the 7-point scale. While overall condition of bridges in the study has improved, the 2012 weighted average rating of 4.54 was still short of the 5.0 threshold for a bridge not to be considered deficient. This suggests that while current levels of investment may be roughly consistent with a “steady state” of stable bridge condition, increases in spending will be required for the average condition of the city’s bridges to improve further. Alternatively, any reduction in spending from current levels carries the risk of deterioration in bridge quality.
Rising construction costs became less of a concern after the construction boom ended in 2008, but may be a problem in the future. Other budgetary pressures, in particular rising debt service and health care costs, may also constrain the city’s ability to invest in infrastructure going forward. Capital commitments for bridges spiked in 2010, due to the influx of federal stimulus funds. Just one year later, however, in 2011 the city revised planned commitments in its 10-Year Capital Strategy downward by 10 percent in order to reduce the projected burden of future debt service.
As the city, state, and nation confront fiscal constraints in coming years, spending on the city’s bridges may be reduced further. The February 2014 Capital Commitment Plan projects $2.6 billion in commitments from 2014 through 2017, an average of $647 million per year, compared with actual commitments in nominal dollars of $440 million per year from 2000 through 2012, and $385 million in 2013. In constant 2012 dollars, planned commitments for 2014-2017 average $611 million per year, compared with $528 million in 2000-2012, and $378 million in 2013.19 However, since actual commitments typically fall short of planned commitments, actual commitments in 2014-2017 may be lower than during the period analyzed in this paper.
Report Prepared by Alan Treffeisen
Endnotes
1City
of New York, Office of the Comptroller. Dilemma in the
Millennium: Capital Needs of the World’s Capital City.
See
http://www.comptroller.nyc.gov/bureaus/eng/complete.pdf. IBO
estimates that in constant 2010 dollars, the investment in
bridges totaled $3.9 billion.
2“A Message from the
Commissioner.” NYCDOT Bridges and Tunnels Annual Condition
Report 2011.
http://www.nyc.gov/html/dot/downloads/pdf/dot_bridgereport11_part1_summary.pdf.
3Unless otherwise noted,
dollar amounts for spending or capital commitments refer to
city fiscal years. Bridge inspection data are reported on a
calendar year basis.
4The year 2000 is chosen
as a starting point because it coincides roughly with a
period of increased capital commitments and spending, as
well as an increased availability of data in electronic
form.
5Of the 788 bridge
structures whose condition is listed in the 2012 Bridges and
Tunnels Condition Report, 674 were inspected by New York
State DOT, 112 by New York City DOT, one (the High Bridge
over the Harlem River) by the city Department of Parks and
Recreation, and one (the East 64th Street Pedestrian Bridge
over the FDR Drive) by Rockefeller University.
6State of New York,
Department of Transportation. Bridge Inspection Manual.
https://www.dot.ny.gov/divisions/engineering/structures/manuals/bridge-inspection.
7DOT reports values of deck space for
all bridge structures in its inventory, including
approaches.
8The 2012 rating of the Brooklyn
Bridge was 2.944, at the upper end of “poor”. In the data
set used for this study, several approaches to the Brooklyn
Bridge are merged with the bridge itself, with the result
that for purposes of this paper the overall rating is
consistently “fair low.” In 2012 there was one small
pedestrian bridge in the city that was closed.
9Bridges have seven-digit
identification numbers. In the case of related structures,
only the seventh digit is different.
10See
http://www.americas.rlb.com/cost-reports.html for recent
reports.
11The capital commitment and
expenditure amounts used for this report include Inter-Fund
Agreement (IFA) amounts. IFA amounts are reimbursements from
the capital budget to the expense budget for the cost of
city employees who work on capital projects.
12The principle of increasing
marginal costs implies that the incremental cost of an
activity, in this case improving bridge quality, will
increase as more of the activity is undertaken.
13The major shift from fair low to
fair high that occurred between 2002 and 2003 was due
largely to the improved condition of the Queensboro,
Manhattan, and Williamsburg bridges, all of which were newly
inspected in late 2002 or early 2003 (calendar years).
14Average reported condition was 3.75
in1999, 3.85 in 2000, and 4.54 in 2012. In addition to
referring to calendar years, these average ratings reflect
the results of the most recent inspection, which may have
been up to two years prior to the end of the year in
question.
15For both commitments and
liquidations, the correlation coefficient with initial
bridge condition was -0.46.
16Regression analyses using a variety
of approaches gave results that were consistent with the
conclusions described in this section.
17IBO defined a sudden serious
decline in condition as a drop of 2.0 or greater in the
numerical rating during a two-year period. (As noted in the
text, bridges are generally rated every two years.) Between
2000 and 2002 only one bridge experienced a rating decline
of 2.0 or more. Between 2002 and 2004 and 2004 and 2006
there were no bridges in this category; between 2006 and
2008, one; and between 2008 and 2010, three.
18All six bridges were rated “good”
or “fair high” in 2012, and only one (the tiny Minthorne
pedestrian bridge in Staten Island with just 1,600 square
feet of deck space) saw its rating drop by more than 1.5
over the entire study period.
19For 2014 through 2017, IBO used the
February 2014 Moody’s Economy.com forecast of the state and
local government deflator.
PDF version available here.
Receive notification of free reports by e-mail