Introduction
Since 1997, New York City has been providing property tax abatements to owners of cooperative apartments (coops) and condominiums (condos). The abatement was instituted as an interim step while a more comprehensive process to address disparities in tax burdens between owners of apartments and owners of one-, two-, and three- family homes was developed. Previous research by IBO has shown that even before receiving the abatement, many coop and condo owners already have property tax burdens comparable to homeowners and that a significant portion of the abatement benefit flows to those owners. Meanwhile, the abatement has been renewed four times and more comprehensive reforms to the property tax system have not been officially proposed by the city.
Although the abatement expired at the end of fiscal year 2012, in the property tax bills for 2013, the Department of Finance (DOF) has assumed the program would be extended.1 (Unless otherwise noted, all years refer to city fiscal years.) Despite efforts to extend or narrow the abatement last spring, the state Legislature adjourned in late June 2012 without passing an extension. Following adjournment, press coverage and statements by the Governor, Mayor, and state legislators suggested that the Legislature would extend the abatement, retroactive to the start of 2013, during a special session after the election. Since Governor Cuomo subsequently decided not to call a special session, it is likely that the extension will be taken up early in the session that begins in January 2013. IBO expects that the program will be extended in some fashion. One possibility would be that the extension bill will be very similar to the final proposal introduced just prior to adjournment, which included changes to abatement eligibility and benefit levels. Another possible outcome would be a straight extension of the current law.
In this report, IBO reviews the latest proposal to extend the coop and condo abatement to be introduced in the state Legislature. The report analyzes how the proposed abatement compares with the current abatement and to an alternative in which coop and condo apartments would be taxed as one- to three-family homes, with a focus on how well the benefit is targeted to address the disparities between apartment owners and other homeowners.
The Coop And Condo Abatement
From 1999 through 2012, the abatement was a 17.5 percent reduction in property taxes for most owners of coops and condos.2 A very small share of recipients, less than 5 percent, received a 25 percent abatement because their apartments’ assessed value was below $15,000. Some coop and condo owners were not eligible for the abatement, including sponsors who still owned apartments, owners with four or more units in a development, and apartment owners in buildings receiving other tax reductions such as 421-a.
According to the Department of Finance, the coop and condo abatement cost the city $444 million in foregone tax revenue in 2012. More than half of the abatements, accounting for over 80 percent of the tax relief, were in Manhattan. Roughly a quarter of the abatement recipients were in Queens and they received just over 9 percent of the tax reduction. Brooklyn had 14 percent of the abatements and about 5 percent of the tax relief. The Bronx and Staten Island had 5 percent and 1 percent of the abatements, respectively, and even smaller shares of the reduction in taxes.
The value of the average abatement was significantly higher in Manhattan, from 4 to 6 times as much as the average in any of the other boroughs. Since the abatement is a fixed percentage of the tax bill, this is the result of higher apartment values in Manhattan.
|
Coop and Condo Abatement Benefit Concentrated in
Manhattan
|
|
|
Abatements,
2012
|
Tax Reduction, 2012
|
Average
Reduction
|
|
|
Number
|
Percent
|
Dollars,
millions
|
Percent
|
|
Manhattan
|
198,140
|
54.3%
|
$371.0
|
83.6%
|
$1,872
|
|
Queens
|
94,917
|
26.0%
|
41.2
|
9.3%
|
$434
|
|
Brooklyn
|
51,612
|
14.1%
|
24.0
|
5.4%
|
$465
|
|
Bronx
|
16,565
|
4.5%
|
6.3
|
1.4%
|
$380
|
|
Staten Island
|
3,527
|
1.0%
|
1.1
|
0.2%
|
$312
|
|
TOTAL
|
364,761
|
|
$443.6
|
|
$1,216
|
|
SOURCE: Department of Finance Annual Report on the
Property Tax, 2012
New York City Independent Budget Office
|
Are Tax Burdens For Apartment Owners Higher Than For Homeowners?
The need for property tax reform for apartment owners is premised on the assertion that apartment owners face significantly higher tax burdens than owners of one-, two-, and three-family homes and that apartment owners should be treated the same as owners of private homes. In other words, homeowners should have similar property tax burdens regardless of whether their home is a coop, a condo, a single-family home, or a two-family home. However differences in the way property tax liability is calculated for homeowners and apartment owners make it challenging to compare tax burdens.
The first step in determining a property’s tax liability is to estimate its fair market value, which is done using different methodologies based on the tax class and property type. In Class 1, which includes one- to three-family homes, market value is estimated based on the sales price of comparable homes. For coops and condos in Class 2, however, Section 581 of New York State real property tax law requires that the city estimate market value as if the buildings are income producing rental properties. Therefore, the city estimates market value based on the income stream of comparable rental buildings.
In most cases the resulting market values for apartments in Class 2 coop and condo buildings are far below the sales prices of individual apartments in those buildings and therefore are not comparable with the market values in Class 1. IBO developed a method to determine a sales-based market value for coops and condos (see IBO’s December 2006 report for a description of our methodology). According to our analysis, the Section 581 discount is about 80 percent for coops and condos that are eligible for the abatement. In other words, the market value of these coops and condos, based on sales prices, would be almost five times higher than the market value that is calculated by the Department of Finance following the process spelled out in state law.
The second step in determining property tax liability is to establish the assessed value for tax purposes. The assessed value of a home in Class 1 can be no more than 6 percent of the market value and cannot increase by more than 6 percent in one year or 20 percent in five years. Some buildings in Class 2, those with less than 11 units, have a similar cap on growth in assessed value: 8 percent in one year or 30 percent over five years. The remaining coops and condos in Class 2 are assessed at 45 percent of their market value. While there is no cap on annual growth, changes in market value—except those resulting from physical changes—are phased in over five years. For all buildings in Classes 1 and 2, assessed value for tax purposes is the assessed value less any exemptions that the building or owner is eligible for.
The third step in determining property tax liability is to multiply the assessed value for tax purposes by the tax rate for that class. The process of setting tax rates for each class is a series of complex calculations intended to keep each classes’ share of the overall property tax levy roughly constant over time, allowing for adjustments based on changes in each classes’ share of total market value. In 2012, the tax rates for Classes 1 and 2 were 18.205 percent and 13.433 percent, respectively. Any abatements, including the abatement for coops and condos, are then credited against the liability.
Given the differences in assessment methodology and tax rates, how do we compare tax burdens between properties in different tax classes? The best way is to look at the effective tax rate (ETR), which measures the taxes paid per $100 dollars of market value. As noted above, the official market value for coops and condos is significantly lower than a sales-based value would be, because the Department of Finance market value is based on income of comparable rental buildings. Therefore, ETRs calculated using the lower official market values will be much higher than those calculated with a sales-based market value.
The bar chart below shows how effective tax rates for 2012 differed among coops and condos based on property type and the method for estimating market value. The blue bars show ETRs using the DOF market value while the pink bars show ETRs using IBO’s sales-based market value. The green bars show sales-based market value ETRs after applying the coop and condo abatement. In other words, the difference between the blue and pink bars is based on how market value is determined. The difference between the red and green bars is the reduction stemming from the coop and condo abatement. The first set of bars is for coops and condos in buildings with fewer than 11 units, the middle for coops in larger buildings and the last for condos in larger buildings.
Sales-based market values are consistent with standard assessment methods because they are based on what individual apartments are actually selling for. They are also comparable to the ETRs for one- to three-family homes since those are also valued based on sales prices.
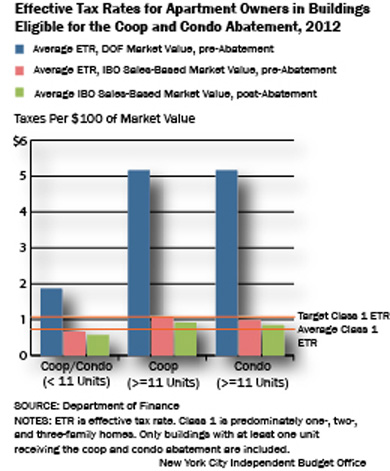
The other question to consider is how coop and condo tax burdens compare with burdens for one- to three-family homes in Class 1. The two orange reference lines indicate the target ETR for Class 1 properties and the average ETR actually paid by Class 1 homeowners in 2012. The target ETR, $1.09 per $100 of market value, is what someone would have paid if their home was assessed at 6 percent of market value (6 percent *18.205 percent tax rate). The average ETR was lower, $0.72, because the cap on annual assessed value growth in Class 1 means that many properties were assessed at less than 6 percent of market value (the median assessment ratio was 5.1 percent of market value in 2012).3 In order to provide the most consistent basis for comparing tax burdens for coops and condos with burdens for Class 1 homes, IBO uses the target ETR for Class 1 and the sales-based ETR for coops and condos. The target ETR in Class 1 is also the effective tax rate that coops and condos would likely face if all of the Class 2 coops and condos were simply moved into Class 1.
Using IBO’s sales-based market value, the average ETR for coops and condos before the abatement was already at or below the target ETR for Class 1 homes in 2012. Moreover, pre-abatement ETRs for coops and condos in smaller buildings (those with less than 11 units) were also below the average ETR for homes in Class 1. Using DOF’s methodology for determining market value, in 2012 coops and condos in smaller buildings had an ETR averaging just under $2 per $100 of market value, well above both the target and average ETR for homeowners. Using IBO’s sales-based market values, however, these coops and condos were below the target and average ETRs for homes in Class 1. The reduction in ETR from the coop and condo abatement brought the average sales-based ETR to around $0.56 per $100 of market value for units in smaller buildings.
Pre-abatement, the effective tax rate for coops and condos in buildings over 11 units in 2012 averaged just over $5.00 per $100 of market value using the DOF market value, while the sales-based market value ETRs ranged from $0.98 to $1.08, at or below the target ETR for homeowners. The coop and condo abatement brought the average ETR for apartments in large buildings down to $0.84 to $0.91 per $100 of market value—below the target ETR for Class 1 but still above the average.
Geographic Variation
As previous IBO research has found, there is considerable variation in ETRs for coops and condos across the city. Measured at the borough level, the Section 581 discount (how much the sales-based market value is discounted as a result of the state law on assessment based on the income of comparable rental buildings) ranged from 78 percent to 83 percent across the boroughs in 2012. Pre-abatement effective tax rates for coop or condo apartments in the Bronx and Queens averaged just over the Class 1 target ETR of $1.09 per $100 of market value—$1.13 and $1.11, respectively. Manhattan was slightly below the Class 1 target at $1.03, while average ETRs in Brooklyn and Staten Island were lower, at about $0.85 per $100 of market value. After the abatement was applied, the ETRs for coops and condos were below the Class 1 target in each of the five boroughs, while the ETRs for coops and condos in Brooklyn and Staten Island were very close to the average ETR for Class 1.
|
Coop and Condo Effective Tax Rates per $100 of Market
Value by Borough, 2012
|
|
|
Apartments
|
Section 581 Discount
|
Effective
Tax Rate,
pre-abatement
|
Effective Tax
Rate,
post-abatement
|
|
Bronx
|
21,498
|
-79.0%
|
$1.13
|
0.97
|
|
Queens
|
114,871
|
-78.7%
|
$1.11
|
0.95
|
|
Manhattan
|
227,166
|
-78.7%
|
$1.03
|
$0.88
|
|
Brooklyn
|
67,687
|
-79.5%
|
$0.85
|
0.73
|
|
Staten Island
|
4,245
|
-83.2%
|
$0.86
|
0.73
|
|
SOURCE: Department of Finance
NOTE: Includes only buildings with at least one unit
receiving the coop and condo abatement.
New York City Independent
Budget Office
|
Variations in effective tax rates across neighborhoods were even greater.4 The maps on page 5 present average 2012 ETRs for coops and condos before and after the abatement. The neighborhoods shaded in yellow had ETRs above the average for Class 1 but below the Class 1 ETR target, while the two blue shades denote neighborhoods with ETRs below the average for Class 1. In contrast, the pink and red neighborhoods had average ETRs above those of Class 1.
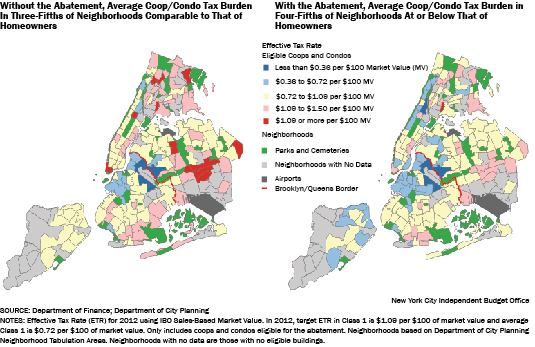
While about 60 percent of neighborhoods had effective coop and condo tax rates comparable to those of Class 1 before the abatement, once the abatement was applied ETRs for coops and condos in 80 percent of neighborhoods were at or below those of homeowners. The blue areas, where coop/condo tax burdens were below the Class 1 average, were concentrated in northern Brooklyn before the abatement and expanded to include northern Manhattan and parts of Staten Island once the abatement was applied. Conversely, prior to the abatement, the pink and red neighborhoods, where the average coop or condo owner had a higher tax burden than the average homeowner, were concentrated in the Bronx, southeastern Queens, southern Brooklyn and along the east side of Manhattan. Once we include the value of the abatement, only one neighborhood, Longwood in the Bronx, remained red (ETR for coops and condos considerably above those of Class 1), while the others became pink (ETRs somewhat higher than those of Class 1). Moreover, many areas that were pink became yellow (roughly comparable to Class 1).
Abatement Inefficiency
Given that the average effective tax rate for coops and condos is similar to the target ETR for homeowners in Class 1, a significant portion of the tax relief from the abatement is flowing to coop and condo owners whose tax burdens are already comparable to those of homeowners, making the abatement an inefficient way to achieve the goal of equalizing tax burdens of apartment and home owners.
IBO defines any abatement that reduces a property’s tax burden below that of the target ETR for Class 1 as excess abatement—tax relief beyond what is needed to equalize tax burdens. Under the current terms of the abatement, about $278 million of the roughly $465 million abatement in 2012 was excess abatement, almost 60 percent.5
Most of that, about $225 million, flowed to apartment owners in Manhattan, while the remaining $53 million went to coop and condo owners in the other boroughs. Conversely, there were 88,386 apartment owners receiving the abatement who continued to see a tax burden higher than the Class 1 target ETR even after the abatement. Together these owners paid about $93 million more in taxes ($76 million in Manhattan and $17 million elsewhere) above what they would have paid if their apartments were assessed like homes in Class 1.
The average excess benefit in 2012 was $1,022. However, this varied greatly based on whether the tax on the apartment was below the Class 1 target ETR before or after the abatement and whether the apartment was located in Manhattan or one of the other boroughs. In Manhattan, the excess benefit averaged just under $1,200 for those apartments below the Class 1 target after the abatement, while it was nearly $1,900 for those below the target before the abatement. The excess benefit was smaller in the rest of the city—averaging $260 for those below the Class 1 target after the abatement and about $460 for those below the target before the abatement.
|
IBO Analysis of Coop and Condo Abatement in 2012
Dollars in millions
|
|
|
Apartments
|
Property Tax Amount Over/(Under) Class 1 Target ETR
Before Abatement
|
Abatement
|
Propert Tax Amount Over/(Under) Class 1 Target ETR After
Abatement
|
Excess Abatement
|
|
Manhattan
|
|
|
|
|
|
|
Below Class 1 Target ETR Before Abatement
|
89,281
|
($341.0)
|
($167.6)
|
($508.6)
|
$167.6
|
|
Below Class 1 Target ETR After Abatement
|
47,674
|
51.3
|
(108.3)
|
(57.0)
|
57.0
|
|
Above Class 1 Target ETR After Abatement
|
58,019
|
188.6
|
(112.5)
|
76.1
|
0.0
|
|
Rest of New York City
|
|
|
|
|
|
|
Below Class 1 Target ETR Before Abatement
|
93,487
|
(82.9)
|
(42.7)
|
(125.6)
|
42.7
|
|
Below Class 1 Target ETR After Abatement
|
41,564
|
8.1
|
(18.9)
|
(10.8)
|
10.8
|
|
Above Class 1 Target ETR After Abatement
|
30,367
|
34.4
|
(17.1)
|
17.2
|
0.0
|
|
SOURCE: Department of Finance
NOTES: ETR is effective tax rate. The Class 1 Target ETR
was $1.09 per $100 of market value in 2012.
New York City Independent
Budget Office
|
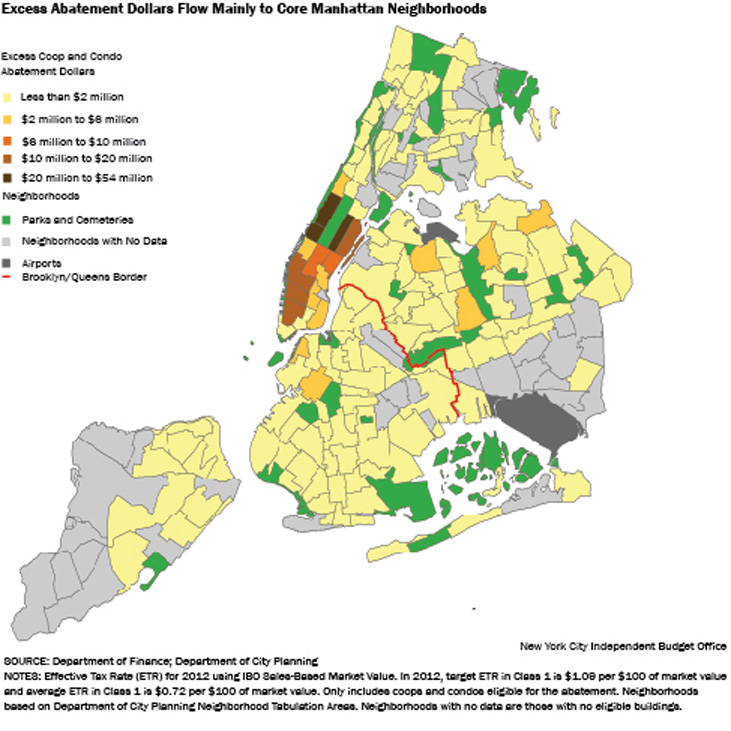
In dollar terms, most of the excess coop and condo tax benefit flows to Manhattan. The neighborhood map of excess abatement dollars shows that the inefficiency was concentrated in Manhattan south of about 96th Street, with from $6 million to $10 million in excess benefits flowing to neighborhoods in midtown east and from $10 million to $20 million in excess benefits flowing to western neighborhoods in Manhattan south of about 34th Street. The inefficiency was greatest in the Manhattan neighborhoods just east and west of Central Park, each of which saw over $20 million in excess abatements in 2012.
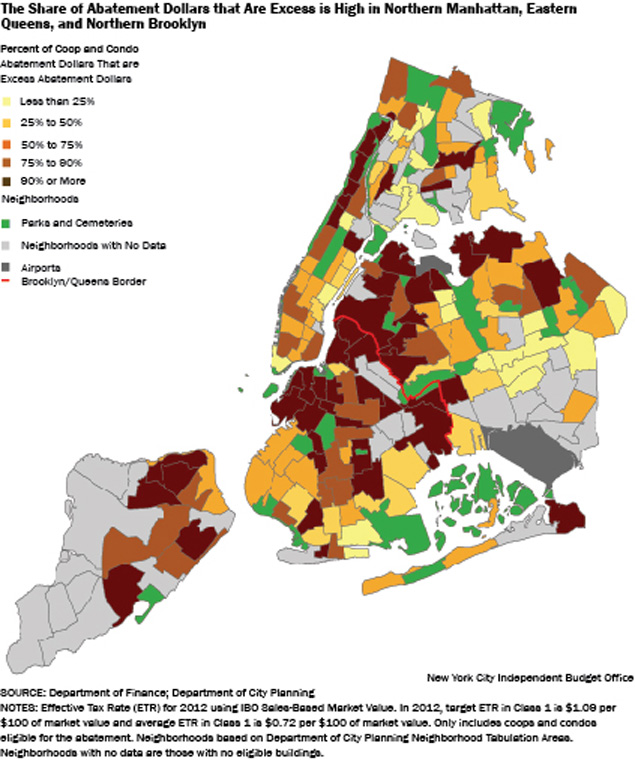
The picture changes, however, when the inefficiency is measured in percentage terms. The neighborhoods shaded in medium and dark brown are those where more than 75 percent of the abatement dollars are excess abatement. These neighborhoods with a high share of excess abatement are concentrated in northern Manhattan, eastern Queens, northern Brooklyn, and northern Staten Island—areas that do not have high levels of excess abatement in dollar terms.
Proposed Abatement Extension
In May 2012, a bill to simply extend the coop and condo abatement without any change through 2016 was introduced in the state Legislature. Then in June 2012, the Bloomberg Administration signaled that it supported making changes and several different bills were introduced that would have extended and amended the abatement.
The last stand-alone version was introduced on June 13, 2012 (A.
10666). It would have extended the coop and condo abatement through 2016 with modifications. The following analysis assesses the modifications proposed in that bill compared with a straight extension of the abatement.
The proposal kept the abatement as is for 2013. From 2014 through 2016, the legislation gradually implemented changes in eligibility and the share of tax bill abated. The proposal limited eligibility to owner-occupied apartments, though an individual could receive the abatement for up to three units in one development as long as one of the units was his or her primary residence. The abatement percentage was gradually reduced for units not occupied by the owner as a primary residence and was completely eliminated in 2016. For owner-occupied apartments, the proposal created additional abatement percentage tiers based on the average assessed value of apartments in the building. The current law provides a 25 percent abatement when the average apartment in a building is under $15,000 in assessed value (determined using the DOF market value), and a 17.5 percent abatement for all other apartments. Under the proposal, the 17.5 percent abatement would apply to buildings with an average assessed value at or above $60,000. Apartments in buildings with an average assessed value below $50,000 would get a 25.0 percent abatement in 2014, increasing to 28.1 percent by 2016. Apartments from $50,000 to $55,000 would see a 25.2 percent abatement by 2016, while those from $55,000 to $60,000 would receive a 22.5 percent abatement.
|
Assessed Value Ranges and Abatement Percentages Proposed
in June 13 Bill
|
|
Abatement for Owner-Occupied Apartments
|
|
|
|
|
|
Abatement
Percent
|
|
Average DOF Assessed Value per Unit
|
2013
|
2014
|
2015
|
2016
|
|
<=$15,000
|
25.0%
|
25.0%
|
26.5%
|
28.1%
|
|
>$15,000 and <=
$50,000
|
17.5%
|
25.0%
|
26.5%
|
28.1%
|
|
>$50,000 and
<=$55,000
|
17.5%
|
22.5%
|
23.8%
|
25.2%
|
|
>$55,000 and
<=$60,000
|
17.5%
|
20.0%
|
21.2%
|
22.5%
|
|
>$60,000
|
17.5%
|
17.5%
|
17.5%
|
17.5%
|
|
Abatement for Non-Owner-Occupied Apartments
|
|
|
|
|
|
|
Abatement
Percent
|
|
Average DOF Assessed Value per Unit
|
2013
|
2014
|
2015
|
2016
|
|
<=$15,000 but not
primary residence
|
25.0%
|
12.50%
|
6.25%
|
0.00%
|
|
>$15,000 but not
primary residence
|
17.5%
|
8.75%
|
4.38%
|
0.00%
|
|
SOURCE:
A. 10666
introduced on June 13, 2012
New York City Independent Budget Office
|
Assessing the Proposal. To assess the impact of the proposed changes, IBO modeled the value of the abatement at the level of individual apartment units under the proposal and under a straight extension. We focused on the abatement in 2016, when the changes would be fully implemented. Then we compared the tax reduction under the proposal with a straight extension of the current abatement and with a scenario under which coops and condos were assessed and taxed as Class 1 properties.
Modeling the proposed change to abatement eligibility required that we use receipt of the state STAR (School Tax Relief) tax exemption as a proxy for owner-occupied apartments. STAR is a state tax exemption for owner-occupied units with household incomes under $500,000. But not every eligible owner signs up for STAR. The income cap, a more onerous application process than for the coop and condo abatement, and a relatively small tax reduction (about $300) discourage some from participating. Moreover, New York State limits the STAR exemption to one per resident, and owners with property in both the city and the suburbs may be more likely to claim STAR on their suburban homes as the tax benefit is greater. For all of these reasons, the number of New Yorkers who participate in STAR is likely to fall short of the number of apartments that are owner-occupied. Therefore, IBO’s estimate of the cost of the proposed abatement should be considered a lower bound.6
Results. IBO found that limiting the abatement to primary residents would reduce the cost significantly, with a maximum (or upper-bound estimate of) savings of about half of the current abatement. Using receipt of state STAR benefits to identify owner-occupied apartments, roughly half of the current recipients would no longer be eligible. Of those who remain eligible, about two-thirds would see a higher share of the property tax bill abated. Excluding apartments not occupied by their owners from the abatement increases the efficiency of the program by reducing the aggregate value of the excess abatement dollars. However, if inefficiency is measured in terms of the share of the abatement that provides excess benefits, the proposal does not improve efficiency, because owner-occupied and non-owner-occupied units are similar in how their tax burdens compare with Class 1 homes and the abatement percentage increases for most owners.
Limiting the Abatement to Primary Residences. The cost of the abatement to the city in foregone tax revenue would be roughly cut in half in 2016, compared with the cost of extending the program without any changes. This reduction stems from a 52 percent decrease in the number of eligible apartment owners when we use receipt of STAR as a proxy for primary residence. Since we suspect that STAR undercounts the number of owners who would be eligible, the likely savings to the city would be less than the estimated $270 million, but clearly of significant magnitude.
Owners whose apartments are not their primary residences are more likely to be in Manhattan than the other boroughs. About 61 percent of current abatement recipients in Manhattan—the borough had 54 percent of all coop and condo abatement recipients in 2012—may be ineligible if the proposal is implemented based on whether they currently receive STAR. In the Bronx, Brooklyn, Queens, and Staten Island, where the remaining 46 percent of recipients live, between 40 percent and 44 percent may be ineligible based on receipt of STAR.
Owners whose coops and condos are not their primary residence are also likely to have apartments with higher assessed values than owner-occupants, which is consistent with the concentration of coops and condos that are not owner-occupied in Manhattan. About 52 percent of current abatement recipients who do not receive STAR—assumed to be owners whose apartments are not their primary residences—have apartments with assessed values over $60,000 (this is consistent with the higher proportion of nonprimary residents in Manhattan with its higher average assessed values). The bulk of apartments are in buildings with average assessed values under $50,000; they are 51 percent of current abatement recipients and 44 percent of them would be ineligible based on using STAR as proxy for primary residence.
Changing the Abatement Percentage. Under the state legislative proposal, about two-thirds of owners who remain eligible for the abatement would see a greater share of their taxes abated. Another feature of the proposal is that the assessed value cut-offs that determine the share of taxes to be abated would change. Currently, most recipients get a 17.5 percent abatement because their apartments have an assessed value over $15,000, while those below $15,000 get a 25 percent abatement. The proposal creates four categories, with the lowest (under $50,000 in assessed value) getting a 28.1 percent abatement and the highest (over $60,000 in assessed value) staying at the current rate of 17.5 percent. About half of the recipients would see their abatement percentage go from 17.5 percent to 28.1 percent.
|
Proposed Primary Residence Requirement Will Reduce Cost to the
City and Reduce Number Of Recipients
Dollars in millions
|
|
|
2016 No Change
|
2016 Proposal
|
Increase/(Decrease)
|
Percent Change
|
|
Abatement Units
|
360,392
|
172,565
|
(187,827)
|
-52.1%
|
|
Cost of Abatement to City
|
$499.0
|
$227.7
|
($271.3)
|
-54.4%
|
|
SOURCES: Department of Finance;
A. 10666 introduced on June 13,
2012
New York City Independent Budget Office
|
Compared with what they would receive in 2016 with no change to the abatement, the average value of the proposed abatement for owners who remain eligible would increase 25 percent for those with apartments below $15,000 in assessed value. But the biggest increase in the average value of the abatement would be enjoyed by owners of apartments with assessed values from $15,000 to $50,000, who would see their abatements rise an average of 61 percent under the proposal. In dollar terms, owners of apartments with assessed value below $15,000 would see savings averaging over $400, owners with apartments valued from $15,000 to $50,000 would see average savings of over $800, and owners with apartments valued above $60,000 would continue to see savings averaging about $2,200.
Does the Proposal Make the Abatement More Efficient?
Making nonresidents ineligible reduces the cost of the program, though the modified abatement would be as inefficient as the current abatement—inefficient is defined as directing tax relief to apartment owners whose tax burdens are below what they would be if they were taxed like Class 1 homes.
To look at the issue of efficiency, we replicate the chart on abatement inefficiency in 2012 presented on page 6 for three groups—all recipients in 2016 under a straight extension, primary resident recipients in 2016 under a straight extension, and primary residents in 2016 if the modified proposal is fully implemented. (The tax rates and target ETR for Class 1 have been updated to reflect the enacted 2013 tax fixing resolution as of November 13, 2012). For each apartment, we estimate the tax liability if the parcel were assessed like a Class 1 home (assessed value set to 6 percent of a sales-based market value). Then we compare that with the projected tax liability before and after application of the abatement. Excess abatement is defined as any abatement that reduces the tax liability below the Class 1 target ETR.
In the first panel of the table on page 11, which assumes a straight extension through 2016, 59.2 percent of the value of the abatement, estimated at $500 million, is going to reduce tax liability below what it would be if the apartments were taxed as Class 1. Most of the excess, $240 million or 81.2 percent, goes to apartment owners in Manhattan. The remaining $56 million of excess abatement dollars flow to the four other boroughs. Additionally, around 91,000 apartment owners pay $107 million more, after the abatement, than if they were in Class 1. Since the straight extension makes no change in the terms of the abatement, these results for 2016 are very similar to those reported earlier for 2012, with an increase in the dollar amounts due to our model’s assumptions about assessed value growth offset by a slightly lower tax rate in Class 2.
When we look only at primary residents (again, receiving STAR is our proxy) under a straight extension (the second panel in the chart), we see that the excess abatement decreases just 1.4 percentage points to 57.8 percent, though the total value of the abatement for owners would be $195 million. This suggests that the abatement flowing to nonresidents was slightly more inefficient than that flowing to residents, but the difference is very small and well over half of the value of the abatement continues to flow to apartment owners to reduce taxes below what they would be if the apartments were assessed as Class 1 homes. Less of the excess abatement, 71 percent or $80 million, flows to Manhattan owners than in a straight extension, while the remaining 29 percent, $33 million, flows to the other boroughs.
The last panel of the chart looks at the excess abatement projected in 2016 under the proposal. This includes apartments occupied by owners as primary residences, with higher abatement percentages for the majority, with a total cost to the city of $228 million. The higher abatement percentages for some recipients mean that more residents are below Class 1 following the abatement, estimated to be about 48,200 apartments in 2016 compared with 40,100 in 2016 under a straight extension. Conversely, the number that remains above Class 1 even after the abatement is reduced slightly, from about 42,500 to 34,300. However, since the value of the abatement increases for most recipients—even those already below Class 1 before and after the abatement—the aggregate excess increases to 61.6 percent of the total abatement amount, 2.4 percentage points higher than what it would be with a straight extension.
The proposal would change the geographic distribution of the inefficiency. The excess flowing to Manhattan totals $87 million while the excess flowing to the other four boroughs totals $53.9 million. Since more apartments owned by nonresidents are in Manhattan, the share of the excess abatement flowing to Manhattan apartments declines to 61.6 percent, while the share flowing outside Manhattan increases to 38.4 percent (more of the units seeing their abatement percent increase are outside Manhattan). Even with the higher abatement percentages, about 34,000 owners (19.9 percent of owner-occupied abatement recipients) pay $40 million more, after the abatement, than if they were in Class 1, about $1,200 on average.
|
Roughly 60 Percent of the Current and Proposed Abatement Dollars
in 2016 Would Be Excess Abatement
Dollars in millions
|
|
|
Current Abatement 2016, All Recipients
|
|
|
Apartments
|
Property Tax Levy Over/(Under) Class 1 Target ETR Before
Abatement
|
Abatement
|
Property Tax
Levy Amount
Over/(Under)
Class 1 Target ETR After Abatement
|
Excess Abatement
|
|
Manhattan
|
|
|
|
|
|
|
Below Class 1 Target ETR Before Abatement
|
86,249
|
$369.5
|
($174.0)
|
($543.5)
|
$174.0
|
|
Below Class 1 Target ETR After Abatement
|
49,963
|
53.4
|
(119.0)
|
($65.7)
|
65.7
|
|
Above Class 1 Target ETR After Abatement
|
58,762
|
211.2
|
(123.1)
|
$88.1
|
0.0
|
|
Rest of New York City
|
|
|
|
|
|
|
Below Class 1 Target ETR Before Abatement
|
94,795
|
(93.0)
|
(45.6)
|
($138.6)
|
45.6
|
|
Below Class 1 Target ETR After Abatement
|
38,660
|
8.8
|
(18.7)
|
($9.9)
|
$9.9
|
|
Above Class 1 Target ETR After Abatement
|
31,963
|
37.8
|
(18.5)
|
$19.3
|
0.00
|
|
TOTAL
|
|
$587.6
|
($499.0)
|
($650.4)
|
$295.2
|
|
% of Abatment that is Excess
|
|
|
|
|
59.2%
|
|
|
Current Abatement 2016 , Primary Resident Recipients
|
|
|
Apartments
|
Property Tax Levy Over/(Under) Class 1 Target ETR Before
Abatement
|
Abatement
|
Property Tax
Levy Amount
Over/(Under)
Class 1 Target ETR After Abatement
|
Excess Abatement
|
|
Manhattan
|
|
|
|
|
|
|
Below Class 1 Target ETR Before Abatement
|
34,066
|
($124.5)
|
($58.4)
|
($182.9)
|
$58.4
|
|
Below Class 1 Target ETR After Abatement
|
18,121
|
17.9
|
(39.6)
|
(21.6)
|
21.6
|
|
Above Class 1 Target ETR After Abatement
|
23,506
|
82.2
|
(47.9)
|
34.3
|
$.0
|
|
Rest of New York City
|
|
|
|
|
|
|
Below Class 1 Target ETR Before Abatement
|
55,956
|
(55.9)
|
(26.8)
|
(82.7)
|
26.8
|
|
Below Class 1 Target ETR After Abatement
|
21,942
|
5.1
|
(10.8)
|
(5.8)
|
5.8
|
|
Above Class 1 Target ETR After Abatement
|
18,974
|
23.0
|
(11.2)
|
11.7
|
0.0
|
|
TOTAL
|
|
($52.3)
|
($194.7)
|
($246.9)
|
$112.6
|
|
% of Abatment that is Excess
|
|
|
|
|
57.8%
|
|
|
Proposed Abatement 2016, Primary Resident Recipients
|
|
|
Apartments
|
Property Tax Levy Over/(Under) Class 1 Target ETR Before
Abatement
|
Abatement
|
Property Tax
Levy Amount
Over/(Under)
Class 1 Target ETR After Abatement
|
Excess Abatement
|
|
Manhattan
|
|
|
|
|
|
|
Below Class 1 Target ETR Before Abatement
|
34,066
|
($124.5)
|
($63.5)
|
($188.0)
|
$63.51
|
|
Below Class 1 Target ETR After Abatement
|
18,821
|
18.9
|
(41.8)
|
(23.0)
|
23.0
|
|
Above Class 1 Target ETR After Abatement
|
22,806
|
81.2
|
(47.8)
|
33.4
|
0.0
|
|
Rest of New York City
|
|
|
|
|
|
|
Below Class 1 Target ETR Before Abatement
|
55,956
|
(55.9)
|
(41.0)
|
(96.9)
|
41.0
|
|
Below Class 1 Target ETR After Abatement
|
29,400
|
9.9
|
(22.7)
|
(12.9)
|
12.9
|
|
Above Class 1 Target ETR After Abatement
|
11,516
|
$8.2
|
(10.8)
|
7.4
|
0.0
|
|
TOTAL
|
|
($52.3)
|
($227.7)
|
($280.0)
|
$140.4
|
|
% of Abatment that is Excess
|
|
|
|
|
61.6%
|
|
SOURCES: Department of Finance;
A. 10666 introduced on June 13,
2012
NOTES: ETR is effective tax rate. The Class 1 Target ETR
is $1.11 per $100 of market value in 2013. Totals may
not add due to rounding.
New York City Independent Budget Office
|
Conclusions
Excluding nonresidents from the coop and condo abatement has the potential to reduce the cost of the program significantly because—based on take-up rates for the STAR program—close to half of the current recipients may no longer be eligible for the abatement. However, the proposal does not address the limitations that make the abatement inefficient, particularly the distortions resulting from how coops and condos are valued. When inefficiency is defined as the share of the abatement that provides excess benefits, the proposal remains as inefficient as the current system, with about 60 percent of the benefit reducing apartment owners’ tax burdens below what they would be if their apartments were taxed as Class 1 properties. If the goal is to give coop and condo owners ETRs comparable to those in Class 1, a more direct shift to Class 1 assessment practices for owner-occupied apartments is likely to be more efficient than an abatement that starts by valuing coops and condos as if they were rental buildings.
Report prepared by Ana Champeny
Endnotes
1See “Condo, co-op tax hike to be delayed” by Andrew J. Hawkins in Crain’s New York Business, November 19, 2012.
http://mycrains.crainsnewyork.com/blogs/insider/2012/11/condo-co-op-tax-hike-to-be-delayed/ Accessed on November 20, 2012.
2The abatement was phased in during the first two years, 1997 and 1998. The abatement percentages were 2.75 percent and 4.0 percent in 1997 and 10.75 percent and 16 percent in 1998.
3Both the target and average ETR in Class 1 change annually based on the tax rate and the average assessment ratio for Class 1 parcels.
4Neighborhoods are based on Neighborhood Tabulation Areas (NTAs) as defined by the Department of City Planning. NTAs are comprised on census tracts and were initially established as part of the effort to project population growth from 2000 through 2030 as part of PlaNYC 2030. There are 195 NTAs in NYC. See
http://www.nyc.gov/html/dcp/html/bytes/meta_nynta.shtml for more information on NTAs and their limitations.
5When IBO estimates the value of the abatement for each individual unit and adds up all the units, our total is slightly higher than the total reported the Department of Finance. This difference may stem from how the abatement is calculated on a per building or per unit basis.
6The type of documentation and ease of the application process required by the Department of Finance could affect the degree of participation in the abatement program.
PDF version available
here.
