
August 24, 1998
The Honorable Mark Green
Public Advocate
1 Centre Street, 13th Floor
New York, New York 10007
Dear Public Advocate Green:
As you requested, the Independent Budget Office (IBO) has conducted an analysis of the cost of reducing the size of public school classes in New York City. Our findings are presented below.
Specifically, you sought operating and capital budget cost estimates for three class size reduction scenarios: capping K-3 classes at 18 students, K-3 classes at 20 students, and grade 4-6 classes at 24 students. Moreover, you asked IBO to assess the maximum available funding to the New York City Board of Education under recent class size reduction initiatives either enacted or under consideration by the state and federal governments.
Reducing class sizes results in additional costs to the city primarily because new teachers would need to be hired and new classrooms would need to be built or otherwise acquired. Those costs would vary considerably depending on implementation strategy. We have modeled two distinct implementation approaches for each of the scenarios described above. The first approach (referred to hereafter as the districtwide approach) would be designed to take advantage of excess capacity wherever it can be found in a district, modifying to some extent the current practice of assigning students to schools based primarily on neighborhood. In contrast, the second approach (school-specific approach) would provide new classes at the schools where they are needed to reduce class sizes to the target levels. Realignment under the districtwide approach uses more of the presently available space thereby reducing the need for new classes and classrooms¾ resulting in lower costs than the school-specific approach.
Based on data provided by the Board of Education, we have estimated the costs of reducing class sizes under each of the scenarios you requested. The following table summarizes our findings.
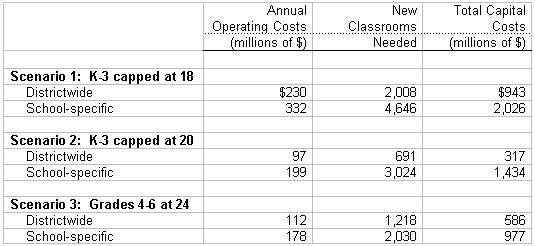
The above estimates are based on enrollment, cost, expected state aid (discussed below), and implementation assumptions described in more detail in the enclosed memorandum. It is important to note that the number of new classrooms needed is net of any classrooms presently in the construction pipeline.
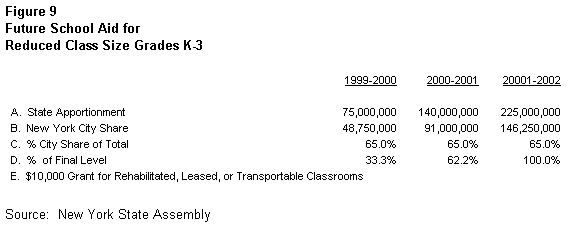
The 1997 New York State budget agreement calls for $75 million in state fiscal year 1999-2000, $140 million in 2000-2001, and $225 million in 2001-2002 in school aid to help reduce class sizes in grades K-3 throughout the state. According to staff from the Assembly, New York City could expect to receive 65 percent of those funds, or $49 million, $91 million, and $146 million over the next three years. While additional funds could be forthcoming from the federal government given the President’s stated intention of working to reduce K-3 class sizes to 18 students throughout the country, no legislation has yet been introduced in the Congress to accomplish that goal. As additional details of the President’s plan emerge, we will apprise you of how such an initiative might benefit New York City.
Stephen Mark and George Sweeting of my staff are the principal analysts who have worked on your request. They can be contacted on 442-0632 if you or your staff have any questions on this estimate. As always, I can be reached on 442-8615.
Warm regards,
Douglas A. Criscitello
Enclosure
Memorandum
To: Douglas Criscitello
From: Stephen Mark, Lorie Logan
Date: August 24, 1998
Re: Cost of Reducing Early Grade Class Sizes: Request from the Public Advocate
Reducing class sizes in the early grades to help improve student performance has become a goal for many public school advocates and policy makers in recent years. In the city, the Board of Education is working on plans to implement a new state initiative which provides funds to reduce some—but not all—early grade classes to 20 students. Earlier this year, Public Advocate Mark Green requested that IBO estimate the contribution the city would need to make to reduce all kindergarten through third grade (K-3) classes in the city to a maximum of 20 students. The costs for two other options, further reducing K-3 classes to 18 students and capping grade 4-6 classes at 24 students, were also requested. This memorandum summarizes our findings.
IBO’s analysis focuses on the cost of class size reduction. These costs are largely driven by salaries for new teachers and the cost of building additional classrooms. The attached tables and graphs document current class sizes in kindergarten through the sixth grade and provide estimates of the costs required to reduce class sizes in those grades. IBO’s analysis is based on school-level enrollment, budget, and capacity data from the Board of Education. A brief explanation of our methodology and data sources is also attached.
Reducing early grade class sizes would require significant budgetary resources. The costs would vary considerably, however, depending on how such an initiative were implemented. IBO has modeled two scenarios for pricing each of the options. In the first scenario, we assume that school assignments within community school districts can be modified to take advantage of capacity wherever in the district it can be found. In practice, this would probably result in neighborhood elementary schools primarily serving kindergarten through the third or fourth grade. Some students in the higher grades would likely be shifted to other schools, perhaps in other areas of the district. In contrast, the second scenario is school specific. All new classes would be provided at the schools which need them to reduce class sizes to the targeted level. Realignment under the first scenario uses more of the available space, reducing the number of new classes and new classrooms needed. Therefore, the costs are lower than under the second scenario.
IBO has estimated the cost to the city of decreasing class size under these two scenarios:
These estimates of the cost of reducing class size are based on one set of plausible assumptions, which are detailed below. The use of alternative assumptions on operating and capital costs, enrollment, and available capacity would alter the results. For example, were more classrooms created by rehabilitating existing buildings, leasing space from private landlords, or buying transportable classrooms, capital costs would be reduced dramatically. Similarly, IBO has relied upon the Board’s projected enrollment levels. Recent years’ enrollment growth, however, has been volatile and difficult to predict. Alternative projections of enrollment would lead to different estimates of need. Enrollment levels could themselves be affected by a class size reduction program: class size reduction programs in Tennessee and Indiana were found to reduce special education referrals and the retention of failing students. On the other hand, smaller class sizes could attract more students to the public schools.
Assumptions about capacity are also critical. IBO has based its capacity level on the Board’s current capacity plans. Those plans are expected to undergo further internal review. Final decisions on implementing the plan will be determined through the city’s capital budget process. The need for new classrooms would decline if year-round schooling were introduced. Conversely, the new state initiative to provide universal pre-kindergarten is likely to put additional strain on school space, thereby increasing the estimated capital cost of reducing class sizes in grades K-6.
It is important to emphasize that the above are estimates of the costs the city would bear in order to reduce class size. As mentioned above, last year’s state budget provided additional operating aid—little funding for capital investment was provided—to local school districts across the state for the reduction of class size to 20 in grades K-3 over three years beginning with the 1999/2000 school year. While this aid will provide funds for all school districts outside New York City to reduce all K-3 class sizes to 20, the aid to the city will not be sufficient. IBO’s estimates account for this new state aid. Moreover, the programs we analyze here are more ambitious and therefore more expensive than the state initiative, in that class sizes are capped at 18, 20, or 24 in our analyses, while the state initiative targets 20 as an average class size.
Current Class Sizes
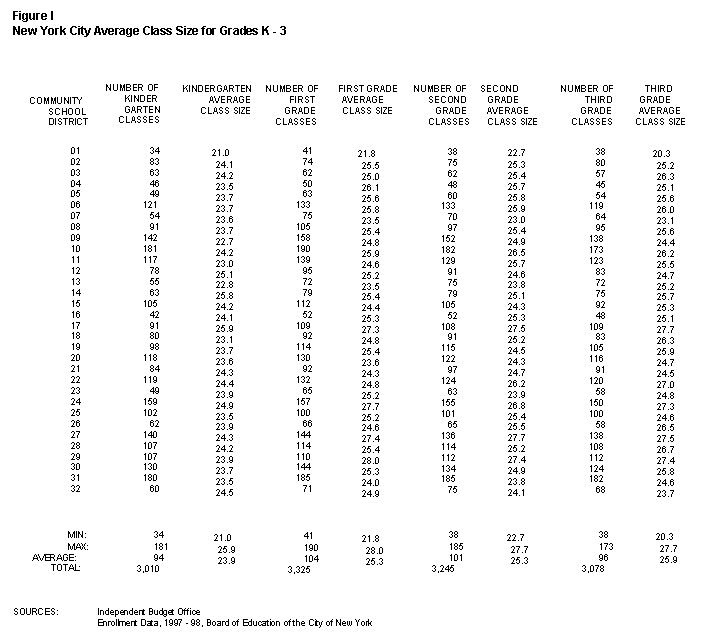
Figures 1 and 2 show average class size by grade in each of the 32 community school districts for the 1997/98 school year. Brooklyn’s District 17 has the most crowded kindergartens with an average class size of 25.9, compared with 23.9 in all city kindergartens. For first and second grades, the most crowded districts are 29 and 27, both in Queens, with average class sizes of 28.0 and 27.7, as compared with an average of 25.3 for each grade citywide. For third grade, average class size ranges from 20.3 in Manhattan’s School District 1 up to 27.7 in Brooklyn’s District 17. The average class size for third grade is 25.9.
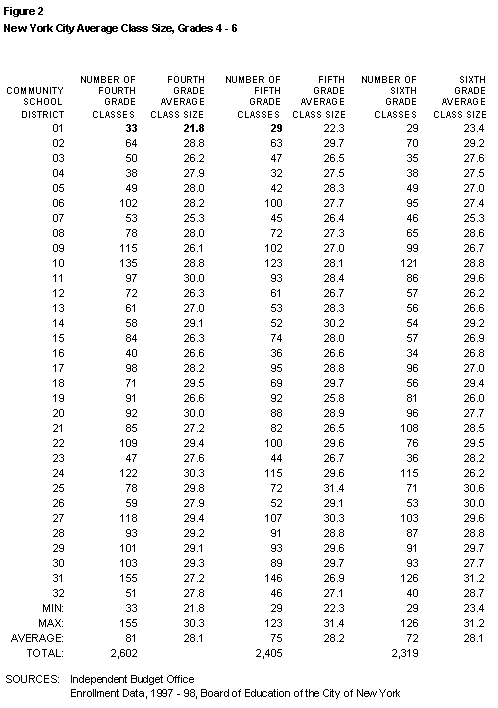
The citywide average class size is just over 28 for grades 4, 5, and 6 (Figure 2). Once again, there is some disparity in class size across districts. While the collective bargaining agreement between the Board of Education and the United Federation of Teachers requires that kindergarten classes have no more than 25 students and other elementary school classes (1-6) have no more than 32, the Board provides funding for teachers intended to produce class sizes of 25 for K-3 and 32 for grades 4 to 6.
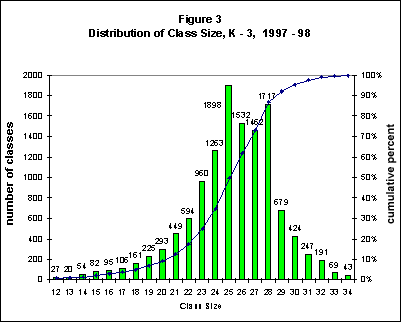
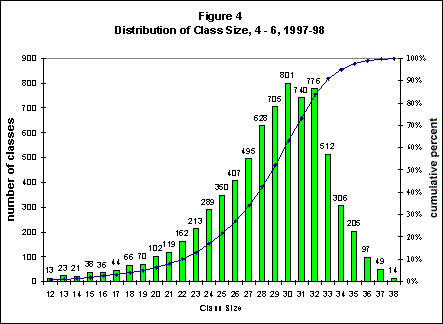
Because averages can hide variation across individual classrooms, the next two figures show the distribution of all New York City elementary school classrooms by class size. Figure 3 shows that 25, 26, 27, and 28 are the most common sizes for classes in the kindergarten to third grade range. Sixty-five percent of all K-3 classes have 25 or more children and 13% have 29 or more. As shown in Figure 4, class sizes are larger for grades 4 to 6, with most classes containing 29, 30, 31 or 32 students. Fifty-seven percent of grade 4-6 classes have 29 or more children and 16% have 33 or more.
Additional Classes and Classrooms Needed
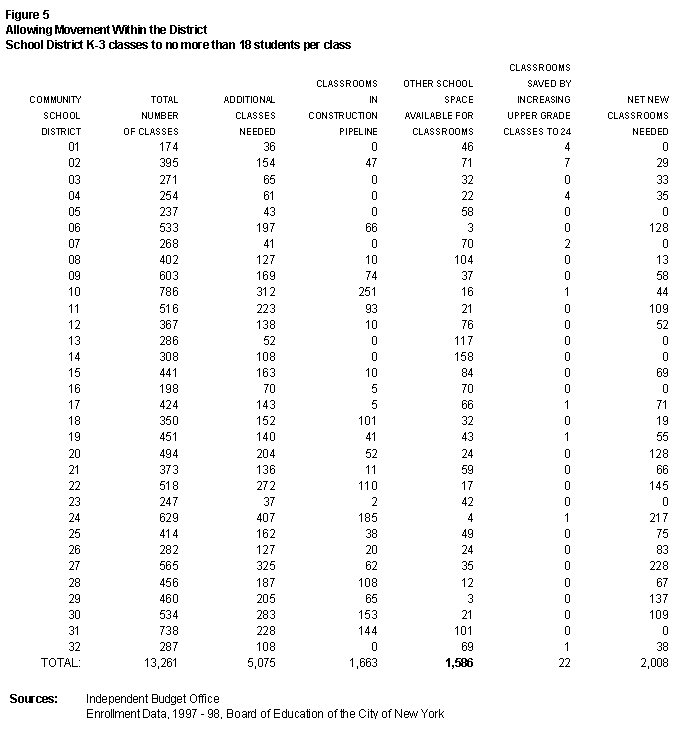
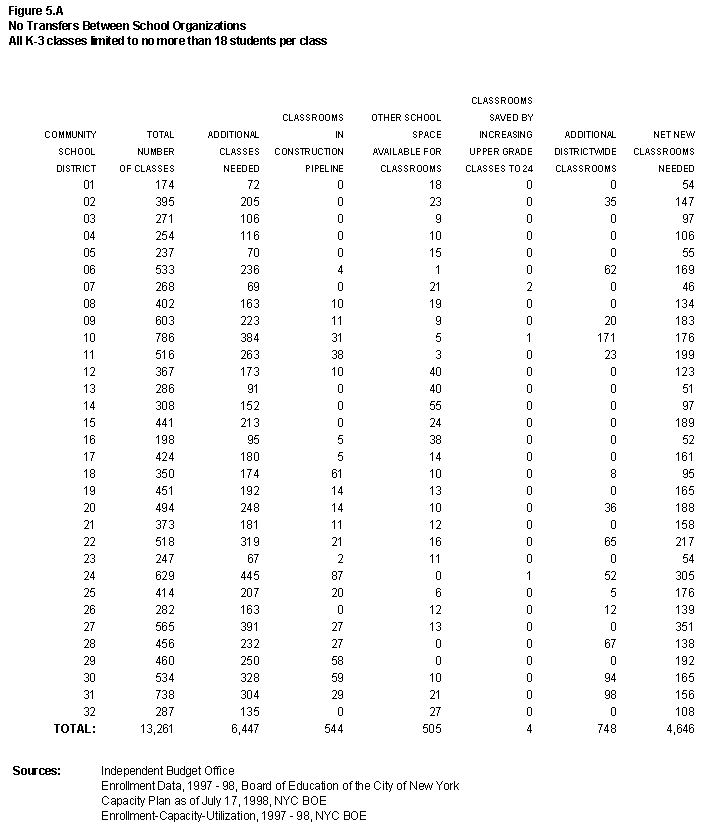
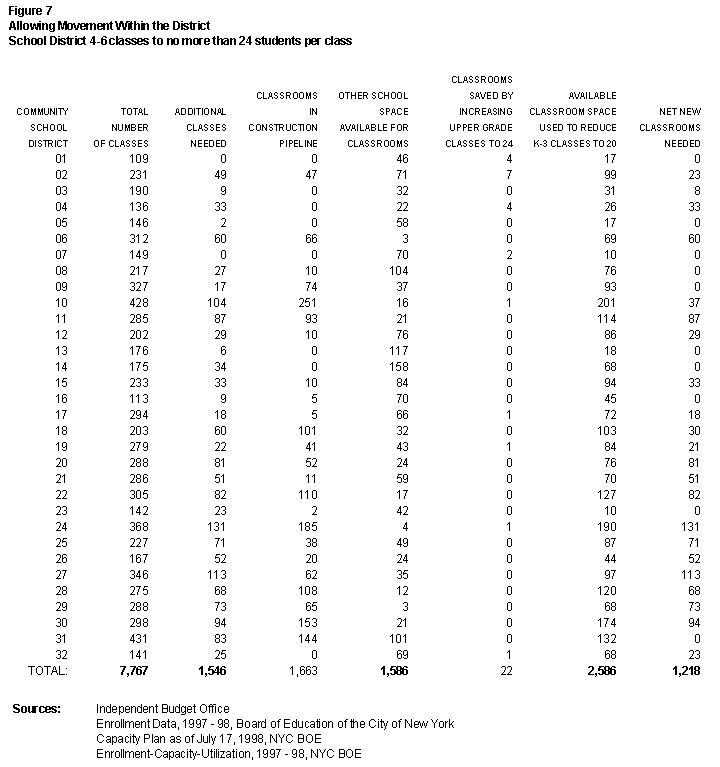
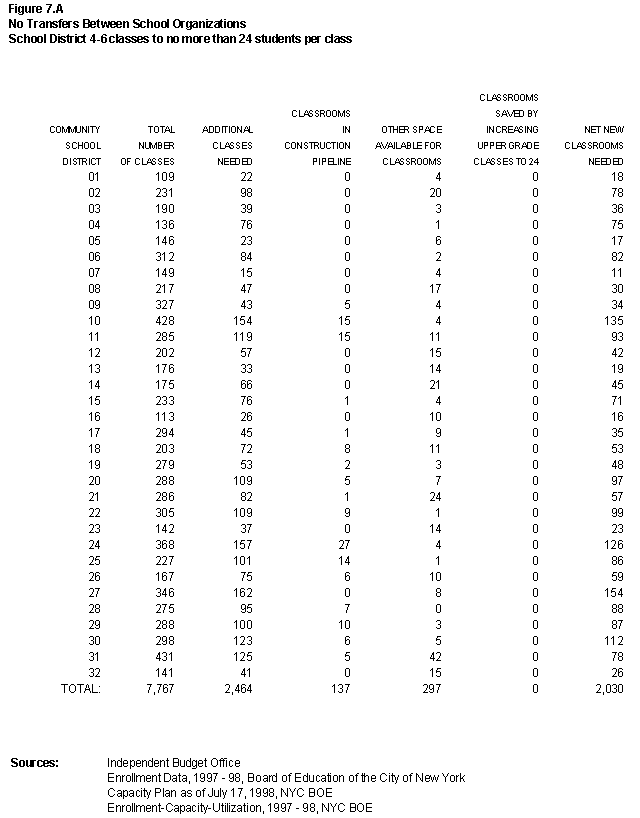
Figures 5 through 7.A report our estimates of the number of new classes and classrooms needed in each district to reduce class size to 18 for K-3, 20 for K-3, and 24 for grades 4 to 6. The enrollment used is based on projections for 2001, and the capacity incorporates new classrooms that the Board hopes to bring on line by 2002. In Figures 5, 6, and 7, classrooms and enrollments were examined districtwide. Because this scenario does not require that the resources will be provided at the schools where they are expected to be needed, it assumes some reassigning of children among the schools in each district. In contrast, estimates contained in Figures 5.A, 6.A, and 7.A are made on a school-specific basis, with all classes and classrooms provided at the schools where they will be needed. In this second scenario, students would remain at their current schools.
In Figure 5, the second and third columns show the number of K-3 classes in each district and the additional classes that would be required to have no more than 18 children in each classroom under the first scenario. The number of additional classes needed, 5,075, is shown in column 3. The remaining columns in the figure are used to estimate the number of new classrooms that would need to be built. Column 4, Classrooms in Construction Pipeline, reflects the reduction in need resulting from all the elementary school classrooms (both additions and new schools) the Board is scheduled to complete between now and 2002. Other School Space Available for Classrooms, the fifth column, shows rooms in schools that the Division of School Facilities deems usable for instructional space in their calculation of school capacity, but which are currently used in other ways. The sixth column, Classrooms Saved by Increasing Upper Grade Classes to 24, shows the number of classrooms that could be made available in under-utilized schools by increasing class size in grades four and above; if a grade level in a school has sufficiently few children in each class, then classrooms can be freed up by consolidating classes in that grade. Taking these additional sources of space into account, IBO estimates that 2,008 new classrooms would be needed to reduce all K-3 class sizes to a maximum of 18 students (column 7) on a districtwide basis.
Turning to the second scenario, Figure 5.A estimates the resources required to limit all K-3 classes to 18, without shifting students to other schools. Without the access to space in all the district’s schools, the Additional Classes Needed (Column 3) increases to 6,447. The next three columns, Classrooms in Construction Pipeline, Other Space Available for Classrooms, and Classrooms Saved by Increasing Upper Grade Class Size to 24, are lower than in the districtwide scenario because available space can only be deployed to the extent it is needed in the school. The figure has one more category of available space. For each district, the seventh column, Additional Districtwide Classrooms, shows classrooms available in the new schools planned for each district, as opposed to additions to existing schools (already accounted for in the fourth column). The final column shows that 4,646 new classrooms would need to be built to provide all K-3 students with classes no larger than 18—more than twice the number required where students can be reorganized within a district’s schools.
Figures 6 and 6.A, similar to 5 and 5.A, estimate the new classes and new classrooms needed to provide all children with classes no larger than 20. The additional classes required come to 3,277 in the first scenario (Figure 6), and 4,657 in the second (Figure 6.A). The new classrooms required in the two scenarios are 691 and 3,024, respectively.
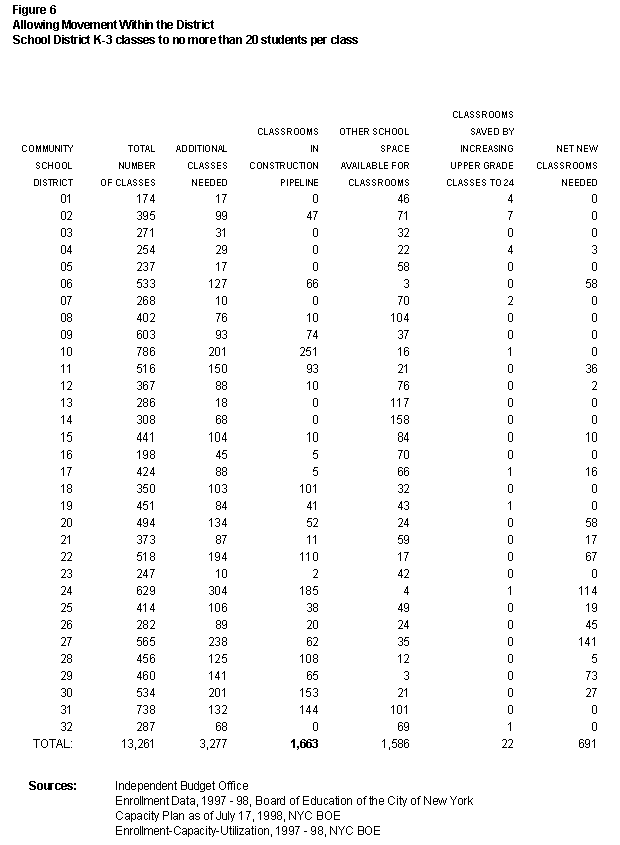

The large differences between the number of classrooms that need to be built under the two scenarios results mainly from three factors. First, even within overcrowded districts, not all schools are overcrowded. Reassigning children from overutilized to underutilized buildings would reduce the district’s need for additional classes. Second, the column Other Space Available for Classrooms is much lower in Figures 5.A and 6.A than in Figures 5 and 6, because in many cases the schools with rooms available are not those that would need new classrooms. Third, requiring that class size be capped at 18 children rather than achieving that number on average requires the creation of many additional classrooms; for example, a school with 19 first graders would require two first grade classes rather than one. Pooling children districtwide would greatly lessen the cost of ensuring a cap of 18 or 20 on all classrooms.
The additional classrooms needed to provide children in grades 4-6 with classes no larger than 24 are shown in Figures 7 and 7.A, the former with and the latter without districtwide shifting of students. The analysis is based on the assumption that the resources necessary to reduce K-3 class size to 20 have already been provided; rooms deemed available here are additional rooms, different from the ones used to reduce class sizes in lower grades. Figure 7 shows that 1,546 additional classes and 1,218 new classrooms would be needed under the districtwide scenario. Figure 7.A shows a need for 2,464 new classes and 2,030 new classrooms under the school specific scenario.
Cost Assumptions
Figure 8 shows the assumptions underlying IBO’s estimates of the operating costs of new classes and the capital costs of constructing new classrooms. The upper portion shows the types of new classrooms that the Board of Education currently plans to build and the cost per classroom for each type. The costs assumed in IBO’s analysis, an average of $481,370 per classroom, are based on these costs per classroom and mix of classroom types.
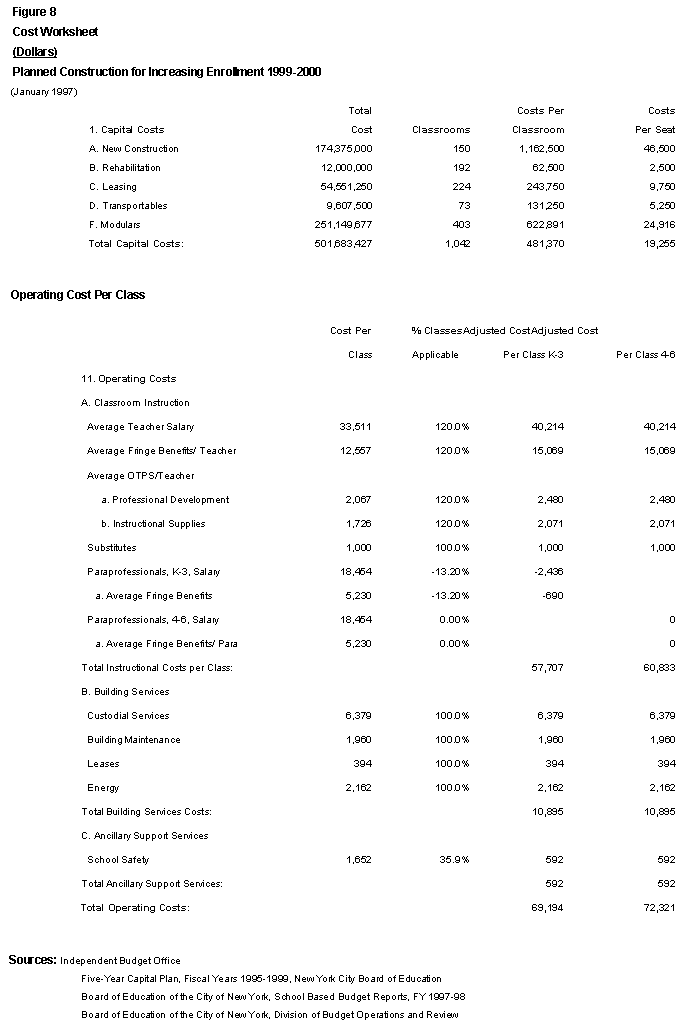
The bottom portion of Figure 8 shows the operating costs of a new class. The teacher salary shown reflects the expected salary of new hires for the 1999/2000 school year. The other budget line items included here are those we judge to be tied to the number of classes rather than the number of children. The column labeled % Classes Applicable allows expenditure items to apply either to some fraction of all the classrooms or to some multiple. For example, because cluster teachers are required for each additional class and are assigned to teach one fifth of the total class time in each week, teacher costs, professional development, and instructional supplies must all be multiplied by 120 percent. In contrast, paraprofessionals assigned to those K-3 classes with more than 28 children (13.2 percent), will no longer be required. Additional school safety costs will be required when a new school space is involved, or in 35.9 percent of new classrooms. The operating cost per new class comes to $69,194 for K-3 and $72,321 for 4-6.
Figure 9 shows that the state is scheduled to spend a total of $225 million per year on K-3 class size reductions by 2001/2002, with expenditures increasing by roughly one third each year. New York City expects to receive 65 percent of these state expenditures each year. In addition to the operating aid, the city will also receive grants of $10,000 per classroom so long as the classroom is rehabilitated, leased, or transportable.
Total Costs
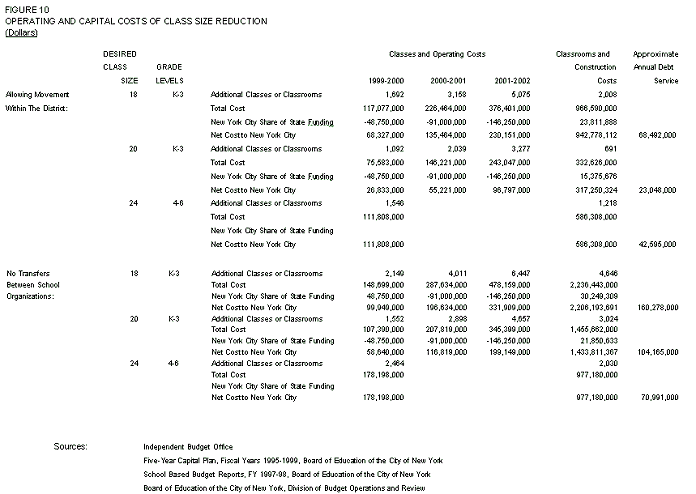
We have modeled the costs assuming a three-year program that grows in conjunction with the state’s early grade class size initiative. Figure 10 summarizes these cost estimates showing, for each class size reduction goal and both scenarios, the increasing number of classes created under the program and operating costs of the new classes borne by the city and the state. The capital costs shown are the total investment required. The last column shows the annual debt service that would be associated with capital expenditures of the amounts shown. Under the districtwide scenario, reducing K-3 class size to 18 or below would cost the city $230 million annually and require $943 million in capital expenditures. In the school specific scenario, operating costs would rise to $332 million annually and capital costs would total $2,206 million. Reducing grade 4 to 6 class size to 24 would cost $112 million annually and $586 million in capital costs in the districtwide scenario and $178 million annually and $977 million in capital costs in the school specific case.
