February 2013
A Matter of Data?
Unraveling the
Discrepancy Between City Job Growth &
A High Unemployment Rate
PDF version available here.

February 2013
A Matter of Data?
Unraveling the
Discrepancy Between City Job Growth &
A High Unemployment Rate
PDF version available here.
Summary
In the years since the Great Recession of 2008 and 2009, economists, policymakers, and others have puzzled over two key measures of the local economy that have at times sent contradictory signals: the number of jobs gained in the city and the local unemployment rate. Despite robust gains in the reported number of jobs located in New York City in 2011 and 2012, employment of city residents did not increase and the city’s unemployment rate has remained stubbornly high.
The jobs and unemployment numbers are derived from separate surveys—one of employers, the other of resident households—both conducted by the Bureau of Labor Statistics. The employer survey showed a gain of 72,700 city-based jobs in 2011 while the resident survey showed gains of just 5,500—a difference of 67,200 jobs. Economists and others looking at the divergent findings have generally relied on three explanations: commuters are taking a large share of the new jobs located in the city, formerly self-employed individuals are going onto business and government payrolls, or the number of multiple jobholders in New York City has grown.
In this report, IBO uses underlying data from another source, the Census Bureau’s American Community Survey for 2010 and 2011, to look at important measures of local employment. We find that the growth of jobs located in New York City has indeed been strong and city residents are getting a substantial share of the new jobs. But this data also shows that the share of city residents who were unemployed remained high. Among the key statistics derived from the American Community Survey:
• Employment in the city by commuters grew by only 6,400 to 855,100 in 2011, dispelling the notion that commuters were taking a significant portion of the new jobs located in the city.
• The number of self-employed city residents increased minimally in 2011 (by just 200 to reach 222,000) while the number of New Yorkers holding multiple jobs decreased by 3,000 to 90,900, eliminating these two factors as explanations of the contradictory data from the labor department surveys.
• Rather than the anemic employment growth shown in the household survey, estimates based on the American Community Survey suggest that employment of city residents increased by 57,000 in 2011—much closer to the job gains found in the employer survey.
• The city labor force grew—rather than shrank as found by the household survey—in 2011, in part because large numbers of workers who had dropped out of the labor force when jobs were hard to find again began to seek employment. A growing labor force kept the city’s unemployment rate high.
Although the discrepancy in Bureau of Labor Statistics data persisted in 2011 and 2012, IBO focused its analysis on 2011 because American Community Survey data for 2012 is not yet available.
Employment growth is a well-accepted indicator of economic activity that is tracked closely, particularly during periods of economic recovery. In the period following the Great Recession of 2008 and 2009, taking the temperature of New York City’s economy by measuring employment gains has been complicated by two seemingly contradictory measures of labor activity, both produced by the federal Bureau of Labor Statistics (BLS).
One BLS data series shows large gains in payroll employment (the number of jobs provided by private- and public-sector employers in the city—in other words, all jobholders except the self-employed) while at the same time a different BLS series shows only small gains in the number of city residents employed. Lackluster growth in employment of city residents, in combination with only small changes in the size of the labor force (the number of people living in the city who are either working or actively looking for work) has produced only slight decreases in the number of unemployed residents and left the city with a consistently high rate of unemployment several years after the recession’s end.
Comparing these two measures on an average annual basis, there is a discrepancy of 67,200 between estimates of payroll and resident employment gains for New York City in 2011 and an even larger discrepancy of 78,500 in 2012. The two surveys that the BLS uses to produce these estimates differ in both their design and intended use and it is possible that these differences in the surveys account for the discrepancy. Three possible explanations are regularly offered: commuters have been taking more of the new jobs than city residents, the extent of self-employment has changed, and the prevalence of multiple jobholding has increased.
This fiscal brief uses data from a third survey, the Census Bureau’s American Community Survey (ACS), to estimate how much of the difference in estimated employment gains can be explained by each of these three factors. Because the most recent ACS data is from 2011, this paper focuses on the difference in estimated employment gains and the magnitude of the possible explanatory factors for that year. (In order to be consistent with ACS data, all references to annual changes in employment using BLS data are made on an annual average basis.)
Background
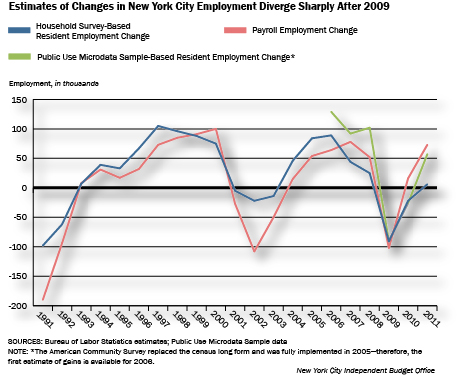
Since employment hit its Great Recession trough in November 2009 through the most recent employment data release, New York City has regained more than 150 percent of the payroll jobs lost during the recession. Yet, the unemployment rate in New York City was 8.8 percent as of December 2012, 2.9 percentage points higher than the unemployment rate at the start of the downturn in September 2008. It is not unusual to see gains in payroll employment accompanied by increases in the rate of unemployment during periods of economic recovery. As the economy recovers and prospects for finding new jobs improve, discouraged workers—individuals who had previously dropped out of the labor force—return to seek employment. When they re-enter the labor force, these individuals often appear in the data as newly unemployed, causing the unemployment rate to increase.1 Yet the estimated size of the city’s labor force shrank rather than expanded in 2011, which is not consistent with the re-entry of discouraged workers.2
Since this easy explanation does not apply to New York City in the early part of the most recent recovery, some question the estimates themselves, especially the high unemployment rate. To evaluate the estimates and explain the discrepancy, economists often compare estimated employment gains and losses from surveys of residents with estimates from surveys of business establishments and government agencies.
Understanding Employment Data Sources and Objectives
The Bureau of Labor Statistics primarily relies on the Current Employment Statistics (CES) survey—popularly known as the payroll or establishment survey—to estimate monthly payroll employment levels. Approximately 160,000 businesses and government agencies nationwide are surveyed about the size of their workforce. Specifically, employers are asked about the number of employees on the establishment’s payroll during the pay period that includes the 12th day of each month. The payroll survey is designed to produce timely measurements of employment, hours, and earnings with much industrial and geographic detail. Once a year, BLS benchmarks their estimates from the survey to the Quarterly Census of Employment and Wages database, which includes all employees who are covered by state and federal unemployment insurance—98 percent of U.S. employees.
The labor department also conducts the Current Population Survey (CPS)—often referred to as the household survey—a survey of approximately 60,000 households nationwide to estimate resident employment each month. The household survey collects a variety of information from respondents including the employment and labor force status of household residents age 16 or older. Specifically, it asks whether the residents reported to work during the week that includes the 12th of the month and whether they were on leave without pay during the reference week. The survey results are weighted by the Census Bureau’s population estimates in the decennial census and by intercensal estimates (from the Census Bureau’s Population Estimates Program) in the decade between each census. The household survey is designed to measure employment and unemployment with significant demographic detail.
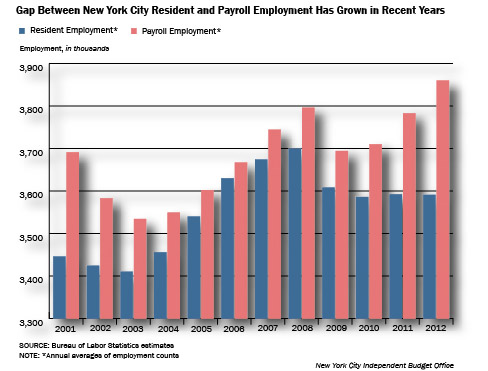
Over the past decade, employment in New York City as measured in the household survey has consistently trailed employment as measured in the payroll survey (graph below). This in itself is not surprising, since the two surveys measure different things. But the size of the difference has changed over time and the discrepancy has been growing since 2009. In 2010, the two measures moved in opposite directions: payroll employment showed gains, while resident employment declined. And in 2011, payroll employment increased by a robust 72,700 jobs, while resident employment added just 5,500—a discrepancy between the two measures of employment gains of 67,200 jobs. The diverging trend has continued into 2012, though reversing its course in September, October, and November.3
Economists have identified a number of differences between the two surveys that have the potential to explain why payroll but not resident employment in New York City has grown since 2009: commuters, self-employed workers, and multiple jobholders.
Commuters. The household survey collects information based on where individuals reside, while the payroll survey collects information based on where individuals work. Some of the divergence in the employment data for New York City could be explained by commuters, individuals who work in the city but reside elsewhere or who reside in the city but work elsewhere. Commuters coming into the city to work (referred to as in-commuters for the remainder of the paper) are counted among the employed in New York City and would be picked up by the payroll survey but not by the household survey for New York City. Conversely, out-commuters would be picked up by the household survey as employed residents but not by the payroll survey for New York City. Bigger job gains by in-commuters than out-commuters could explain some part of the much larger increase in the number of jobs located in the city than in the number of city residents with jobs.
Self-employed Individuals. The payroll survey of firms and government agencies does not pick up individuals who are self-employed. On the other hand, the household survey’s count of the number of people working captures both self-employed individuals and those who work at establishments. Some of the discrepancy in employment gains from 2010 through 2011 could be explained by a shift of city residents from self-employment in 2010 to payroll employment within the city in 2011. The change in these residents’ type of employment would not alter the household survey’s employment count, for in each year they would be considered employed. But the addition of these residents to the payrolls of city businesses would be counted by the payroll survey as additional jobs in 2011.
Multiple Jobholders. Finally, even if there were no commuting in or out of the city or self-employed city residents, there need not be a one-to-one correspondence between the number of jobs in the city and the number of people living and working in the city because some people have more than one job. The household survey counts employed individuals only once even if they hold multiple jobs, while the payroll survey counts the number of jobs held.4 Some of the recent discrepancy between payroll and resident employment gains in New York City could be explained by an increase in multiple jobholding, particularly individuals who both live and work in the city.
Deriving Residency & Employment From The American Community Survey
IBO used data published by the Census Bureau plus supplemental information from the BLS household survey to estimate the extent to which each of these factors explains the much stronger growth in payroll employment in New York City in 2011 than in employment of city residents (see sidebar for details).
The Census Bureau makes available to researchers Public Use Microdata Sample (PUMS) data, which is derived from the bureau’s American Community Survey (ACS). The ACS, which was fully implemented in 2005, is a monthly survey of approximately 250,000 residences nationwide designed to aid in the administration of state and federal programs by collecting primarily demographic information.5 Although the ACS asks questions that address the employment status of each household member, similar to the questions asked by the household survey, the ACS provides more information than the household survey. By collecting data on the place of work of those being surveyed, the ACS allows the identification of both in-commuters and out-commuters. Moreover the ACS specifically asks respondents if they are self-employed. Although the ACS does not ask whether individuals hold multiple jobs, we have used information from the household survey to identify trends in multiple jobholding.6
|
Using "PUMS" to Identify Residents, Commuters, Self-Employed, Establishment-Employed, and Unemployed |
|
Using PUMS data from New York, New Jersey, Connecticut, and Pennsylvania, IBO establishes residency and job locations from their respective Public Use Microdata Areas reported in the PUMS data, and classifies respondents as residents or commuters. Those surveyed in a residential setting or in noninstitutional group quarters are included in the analysis. The Census Bureau looks at a number of responses in the surveys to determine labor force and employment status, producing a "recode" variable in the data set for each person surveyed. IBO has used this recode to establish whether a respondent is in the labor force and if they are employed. To identify those city residents who would be counted by the household survey but not the payroll survey, IBO defines the self-employed as those who work for themselves in an unincorporated business, whether they are sole proprietors or partners. Resident employment includes both the self-employed and those employed in all establishments, whether located in New York City or elsewhere; the latter includes those who would be counted by the payroll survey. To make our identification of unemployed residents consistent with the household survey—those without a job but actively looking for work—IBO’s count of the unemployed in the labor force includes residents whom the Census Bureau has coded as "unemployed," with the exception of those who are identified in PUMS data as having been "unemployed and last worked five years ago or earlier or never worked." |
Explaining the Discrepancy
IBO estimated the number of in-commuters, out-commuters, self-employed individuals and multiple jobholders using 2010 and 2011 PUMS data (2012 PUMS data are not yet available) and household survey data for multiple jobholders. The difference in these counts is the estimated gain or loss in each worker category. IBO finds small net gains among in-commuters, a very small increase in self-employed residents and a decrease in the number of multiple jobholders—none of which do much to explain the discrepancy between estimates of resident and payroll employment gains.
Commuters, the Self-Employed, and Multiple Jobholders. Using PUMS data along with household survey data for multiple jobholders, IBO estimates that employment among in-commuters increased by approximately 6,400 jobs in 2011, while out-commuters experienced gains of 4,700 jobs. The net gain, in favor of in-commuters, explains approximately 1,700 jobs (2.5 percent) of the 67,200 job discrepancy between gains in employment as measured by the payroll and household surveys.
Changes in counts of self-employed and multiple jobholders from 2010 to 2011 explain even less of the discrepancy. A decline in the number of self-employed city residents could help explain why payroll employment increased to a much greater extent than resident employment. But as shown in the table below, the number of self-employed New Yorkers edged up in 2011, so the change in self-employment contributes nothing to the explanation of the discrepancy.
The data also do not support the hypothesis that changes in multiple jobholding explain the difference between measures of employment gains. An increase in the number of city residents who hold multiple jobs could explain greater payroll employment growth relative to resident growth, but the household survey data indicates that multiple jobholding actually fell from 2010 to 2011.
|
Estimates of Commuters, the Self-Employed
And Multiple Jobholders |
|||
|
|
2010 |
2011 |
Difference |
|
In-Commuters* |
848,700 |
855,100 |
6,400 |
|
Out-Commuters |
372,600 |
377,300 |
4,700 |
|
Resident Self-Employed
in New York City |
221,800 |
222,000 |
200 |
|
Multiple Jobholders |
93,900 |
90,900 |
-3,000 |
|
SOURCES: Public Use
Microdata Sample; Current Population Survey Data for
Multiple Jobholders
New York City Independent Budget Office |
|||
All things considered, only a small amount of the discrepancy is explained by differences in how the two surveys account for commuters, the self-employed, and multiple jobholders. More than 97 percent of the discrepancy remains, suggesting that we consider another explanation: the accuracy of the employment estimates from the two surveys. The payroll survey data is widely regarded as the more reliable source for employment estimates because it is benchmarked annually to a near census of business and government establishments. The reliability of the payroll survey—coupled with IBO’s findings about commuters, the self-employed, and multiple jobholders—leads us to suspect that the household survey’s estimate of resident employment gains from 2010-2011 may be too low.
An Alternative Measure of Employment of City Residents. Using PUMS data from the ACS and a methodology similar to what the Bureau of Labor Statistics uses for the household survey, IBO estimated the number of New York City residents employed, the number unemployed, and the size of the labor force. With these estimates, we then calculated an unemployment rate for city residents.
|
Public Use Microdata Sample-Based Estimates of
Resident Employment, Labor Force, and Unemployment |
|||
|
2010 |
2011 |
Difference |
|
|
Resident Employment |
3,693,900 |
3,750,900 |
57,000 |
|
Labor Force |
4,065,300 |
4,119,000 |
53,700 |
|
Unemployed Individuals |
371,400 |
368,200 |
-3,300 |
|
Unemployment Rate |
9.1% |
8.9% |
-0.2 pps. |
|
SOURCE: Public Use Microdata Sample
New York City Independent Budget Office |
|||
The PUMS data show much larger 2011 employment gains for New York City residents than the official estimates from the Bureau of Labor Statistics’ household survey (table below). Based on the PUMS estimate, city residents gained 57,000 jobs in 2011, more than 10 times as many as the 5,500 job gain estimated in the household survey. Moreover, these employment gains for residents approach the 72,700 increase in establishment employment estimated in the BLS payroll survey. Using the PUMS estimate of resident employment, the discrepancy between measures of payroll and household employment gains is a much smaller 15,700 jobs (72,700-57,000), as compared with the 67,200 job difference using the BLS household survey.
The strong increases in New York City employment shown in the payroll survey has led some observers to question BLS household survey estimates which showed that the city’s unemployment rate remained a persistently high 9.0 percent in 2011, only 0.5 percentage points lower than in 2010. Using the PUMS data to estimate the count of unemployed individuals and the size of the labor force, IBO estimates that the city’s unemployment rate was 8.9 percent in 2011, down slightly from 9.1 percent in 2010. The two estimates of unemployment rates for 2011 are very similar, with the PUMS-based estimate providing support for the estimate by the BLS.
The large PUMS-based estimate of resident employment gains from 2010 to 2011 did not result in a much lower estimate of our PUMS-based unemployment rate because the ACS data also showed a large increase in the labor force in 2011. The labor force gain of 53,700 estimated using PUMS approached the same level as the gain in employment (57,000), so the count of unemployed individuals decreased by only 3,300. A large gain in the labor force is consistent with the expectation that formerly discouraged workers re-enter the labor force to find work when they perceive more and better job opportunities. With employment gains for the year heavily offset by an increase in the size of the labor force, PUMS-based estimates of the number of individuals unemployed and the rate of unemployment barely edged down in 2011.
Conclusion
In this study, IBO sought to explore why the increase in New York City payroll employment in 2011 was far greater than the increase in the number of city residents with jobs as measured by the BLS. We looked at three commonly offered explanations for the difference: commuters have taken more of the new jobs than city residents, the extent of self-employment has changed, and the prevalence of multiple jobholding has increased. Using data from the BLS’s payroll and household surveys along with PUMS data from the Census Bureau, IBO finds that none of the three explanations explain more than a small share of the discrepancy between payroll and resident employment gains in 2011.
IBO also produced an alternative measurement of resident employment gains using the PUMS data and found much larger resident employment gains than those estimated with the BLS household survey. The PUMS-based estimate of resident employment gains in 2011 effectively eliminates the discrepancy between payroll and resident employment gains and leads to a much stronger conclusion on the health of New York City’s economy: city residents enjoyed robust job growth in 2011. Despite this growth, the unemployment rate for city residents remained stubbornly high. Based on our estimates derived from PUMS data, the labor force actually grew—rather than shrank—in 2011, probably driven by re-entry of job seekers who had previously dropped out. Finally, IBO’s work does not support the contention that the unemployment rate reported by the BLS is too high.
This report prepared by Julie Anna M. Golebiewski
Endnotes
1
Because only unemployed individuals actively searching for jobs are counted in the labor force, discouraged workers do not enter into the calculation of the unemployment rate.2
In contrast, the increase in the BLS-measured unemployment rate appears to have been driven by the re-entry of discouraged workers into the labor force in 2012. The number of individuals unemployed increased by 23,300 in 2012, driven almost entirely by an increase in the labor force.3
Payroll employment grew faster than resident employment through most of 2012, widening the sizeable gap that has persisted through the recovery. From September through November, however, the trend reversed with resident employment gains outpacing those in payroll employment. December’s gain in payroll employment of 18,000 again exceeded the resident employment gain of 10,600, but this was not surprising given November’s estimates—payroll employment fell by 20,300, reflecting the effects of Hurricane Sandy, whereas resident employment increased by 9,400.4
In the payroll survey, the BLS accounts for the possibility of multiple jobholders in a limited way. If an individual holds more than one job with the same employer, the survey counts that individual as holding one job.5
In addition to households, residences include group quarters such as nursing homes, college dormitories, and prisons. However, we have removed institutional group quarters from our analysis.6
The ability to use the household survey to estimate multiple jobholding is less than ideal because multiple jobholding among in-commuters and out-commuters cannot be identified, given the survey’s lack of information on work location. In addition, some of the multiple jobholders may be self-employed in their second jobs, which would not contribute to the discrepancy between the two employment measures.PDF version available here.