September 2012
Graduates, Dropouts, Discharges:
Tracking Four-Year Outcomes
for the Class of 2009
PDF version available here.

September 2012
Graduates, Dropouts, Discharges:
Tracking Four-Year Outcomes
for the Class of 2009
PDF version available here.
Summary
Since the 2001–2002 school year, the city’s Department of Education has reported dramatic increases in high school graduation rates. These increases have prompted questions from some education analysts and advocates about how the city calculates graduation rates.
IBO’s analysis of individual student records for the class of 2009 yields estimates of the graduation and dropout rates that closely match the education department’s official calculations. Going beyond the computation of these rates, this report also looks at questions such as: After four years, how many students in the class of 2009 have been discharged and what were the specific reasons? How did outcomes differ based on demographic characteristics such as poverty level, country of origin, and race and ethnicity? How indicative of high school outcomes are factors such as attendance rates and performance on the eighth grade state tests? Among our findings:
Class of 2009 students who were proficient in math and English based on their eighth grade test scores were more likely to graduate than students who were not proficient. Students who attended high school more often were more likely to graduate than those who did not.
Introduction
The New York City public school system has reported dramatic increases in the high school graduation rate since 2002. Prior to 2002 the reported graduation rates for New York City’s public school students had changed little since first being reported in the mid-1980s. Claims that student outcomes have improved during the Bloomberg Administration partially rest on this improvement in reported graduation rates.
At the same time questions have been raised about the school system’s calculation of graduation rates and about school practices which may be inflating these rates. The questions about the Department of Education’s (DOE) methodology largely concern the city’s treatment of students who are discharged from high school. These are students who are reported as leaving the New York City public school system without either graduating or dropping out. State regulations require schools to possess some evidence that a student has enrolled in a school elsewhere before they can classify a student as being discharged. Discharged students, who account for as much as 20 percent of a high school cohort in New York City, are removed from the calculation of graduation and dropout rates. To the extent that students are mischaracterized as discharges rather than dropouts, the city’s reported graduation rate would be overstated. A 2009 audit by the New York State Comptroller found some evidence of students being misclassified as discharges, but concluded that the effect was not large and that New York City’s reported graduation rate was generally accurate.
In addition to raising issues about discharges, observers have also raised concerns that the integrity of Regents exam scoring and the practice of credit recovery may also be inflating graduation rates. A 2012 DOE internal audit examined records from students who graduated from 60 high schools in 2010. After conducting an independent rescoring of Regents exams, the audit found inconsistencies at 14 high schools. At these schools, the scoring variability for students with a score that flipped from passing to failing after rescoring was found to be outside what the auditors considered an acceptable range in at least one Regents subject.1 An upcoming IBO report will examine the patterns of Regents exam scores among graduates, dropouts, and discharged students.
This report looks in detail at the data that the Department of Education used to produce its estimate of graduation and dropout rates for the high school class of 2009. It documents when students enter and leave the school system, where they go, and how often they attend school throughout their high school careers. Unlike the published reports from the city and state education agencies, we also report on the timing and extent of students leaving the school system as discharges.
The report begins by defining the cohort of students who make up the class of 2009. It then describes where these students were after four years, the extent to which students enter and leave the school system, and details the timing and the specific reasons that students drop out or are discharged from high school. A third section demonstrates how students vary in their four-year high school outcomes by demographic characteristics such as poverty status, country of origin, and race and ethnicity. This section also documents the relationships between high school outcomes and achievement-related indicators such as attendance and eighth grade test scores. A final section explores how the rate at which students are discharged varies at individual high schools.
Defining the Class of 2009
IBO assembled data on a cohort of students who were or would have been members of New York City’s high school class of 2009 by analyzing the movement of individual students within the school system. IBO’s class of 2009 cohort is composed of all students entering high school as general education, non-charter school students for the first time as ninth graders in the 2005-2006 school year, 10th graders in 2006–2007, 11th graders in 2007–2008, or 12th graders in 2008–2009. Students who spent time at charter schools or in special education status were included only if they also met the first time general education, non-charter enrollment criteria in one of these grades and years. Students who had transferred to a charter school by the end of the period were counted as discharges. Those who had moved from general education public high schools into District 75 special education programs by the end of the study period were excluded from the cohort, as were those who moved into District 79 General Education Development (GED) programs directly from special education. The cohort includes all students enrolled for at least one day—students who were discharged on the same day they enrolled were ignored. Students in a five-year program at Aviation High School were included only if they were expected to graduate in 2009.
All students in the cohort were tracked from September 2005 through August 2009 and classified as graduates, dropouts, discharges, GED diploma recipients, or still enrolled, based on their status as of September 9, 2009. Students receiving a local, Regents, or Advanced Regents diploma were classified as graduates, as were a small number who completed an Individualized Education Program (IEP). Discharged students are those who left the school system for various reasons without graduating or dropping out, such as those who transferred to a school outside of New York City.
Where Are Students After Four Years?
Of 89,750 students in the IBO class of 2009 cohort, about 19 percent were discharged between September 2005 and August 2009. The remaining 72,557 students constitute the “analysis cohort” from which graduation and dropout rates are calculated. Just under 66 percent of this group graduated, 12 percent dropped out, and 21 percent were still enrolled, with under 2 percent receiving GED certificates. Table 1 shows a summary of four-year outcomes for students in IBO’s cohort, compared with DOE’s graduation numbers for the class of 2009 using the city’s “traditional” methodology.2
Although the purpose of this study was not to exactly replicate DOE’s graduation rate, IBO’s numbers closely match the official DOE calculation. The graduation rate among IBO’s cohort is about 0.3 percentage points lower than the DOE calculation, with the share of students still enrolled being higher by 0.8 percentage points.3
| Table 1 Class of 2009 High School Cohort, Independent Budget Office and Department of Education Calculations |
||||
| IBO (N) | IBO (%) | DOE (N) | DOE (%) | |
| Total Class Size | 89,750 | 89,452 | ||
| Less Discharges | 17,193 | 16,979 | ||
| Analysis Cohort | 72,557 | 72,473 | ||
| Graduates | 47,706 | 65.75% | 47,884 | 66.07% |
| Still Enrolled | 15,138 | 21.41% | 14,930 | 20.60% |
| Dropouts | 8,537 | 11.79% | 8,177 | 11.28% |
| GED Recipients | 1,176 | 1.45% | 1,482 | 2.04% |
| SOURCE: IBO analysis of Department of
Education data on individual student records NOTE: IBO used a criterion for identifying students as part of the cohort, detailed above, that is slightly different than the method used by DOE.Some students who moved in and out of special education status during high school may be treated differently. |
||||
Disaggregating the primary outcome categories provides more detail on where students were after four years (Table 2). The class of 2009 could earn one of three primary diploma types. A traditional Regents diploma requires students to pass New York State Regents exams with a score of 65 in five subjects—English, math, science, global history, and U.S. history. An advanced Regents diploma requires passing additional tests in math and science, as well as a foreign language. Local diplomas were in the process of being phased out for students entering high school in 2005–2006, and students in the class of 2009 could earn a local diploma by passing three Regents exams with a score of 55 and two with a score of 65. Starting with the class of 2012, local diplomas are no longer available except for students with an IEP or certain other accommodations. Nearly half of graduates from the class of 2009 received standard Regents diplomas, with about a quarter receiving advanced Regents diplomas and another quarter receiving local diplomas. About 1 percent of graduates left high school with credentials other than a Regents or local diploma, most of whom received an IEP diploma.
| Table 2 Class of 2009 High School Cohort, Detailed Four-Year Outcomes |
||
| Number | Percent | |
| Graduates | ||
| Regents diploma | 23,054 | 48.3% |
| Advanced Regents diploma | 12,299 | 25.8% |
| Individualized Education Plan diploma | 369 | 0.8% |
| Proof of receipt of high school diploma elsewhere or met requirements at non-diploma institution then graduated |
49 | 0.1% |
| Received Local, IEP, or Equivalency Diploma at Earlier Date |
31 | 0.1% |
| Total | 47,706 | 100.0% |
| Still Enrolled | ||
| DOE School or Program | 15,028 | 99.3% |
| DOE Young Adult Borough Center Program | 45 | 0.3% |
| DOE GED Program | 33 | 0.2% |
| Completed Home Schooling | 32 | 0.2% |
| Total | 15,138 | 100.0% |
| Droputs | ||
| Voluntary withdrawal after 20
consecutive absences |
7,337 | 85.9% |
| Address unknown after
investigation by attendance teacher |
697 | 8.2% |
| Non-DOE par-time GED program | 264 | 3.1% |
| Full-time employment certificate | 112 | 1.3% |
| Enrolled in business,
trade, vocational, training program or military service |
76 | 0.8% |
| Voluntary withdrawal due to pregnancy | 44 | 0.5% |
| Met requirements at
non-diploma institution, no diploma |
7 | 0.1% |
| Total | 8,537 | 100.0% |
| Discharges | ||
| School Outside NYC | 12,285 | 71.5% |
| NYC Parochial School | 2,317 | 13.5% |
| NYC Private School | 1,187 | 6.9% |
| Institutionalized (Non-DOE) | 662 | 3.9% |
| Non-DOE full-time GED program | 274 | 1.6% |
| Transferred to Charter School | 202 | 1.2% |
| College early admission without graduation |
173 | 1.0% |
| Deceased | 48 | 0.3% |
| Aged out over 21 years old | 45 | 0.3% |
| Total | 17,193 | 100.0% |
| GED | ||
| Received high school
equivalency diploma |
1,176 | 100.0% |
| SOURCE: IBO analysis of Department of
Education data on individual student records NOTE: Starting in 2010, students who aged out are counted as dropouts rather than discharges. For student accounting purposes in the city’s graduation rate computation, students who complete home schooling are counted as still enrolled |
||
Of the 17,193 students recorded as discharged from the class of 2009, nearly 72 percent were identified as enrolling in a school outside the city, with another 20 percent enrolling in a New York City parochial or private school. Of the remaining discharged students, some were discharged for reasons which critics of DOE have argued should more properly classify them as dropouts based on federal guidelines.4 If the city’s calculation had followed federal guidelines, 662 students who were discharged due to institutionalization and 274 who were discharged to a non-DOE GED program would be counted as dropouts.5 Counting these students as dropouts would have the effect of reducing the graduation rate by 0.6 percentage points.
The vast majority of dropouts left school under the standard dropout code, indicating voluntary withdrawal after 20 consecutive days of absence. About 8 percent stopped coming to school, and an investigation from an attendance teacher could not make contact with the student or confirm their current address. A smaller number of students were counted as dropouts after leaving school for an educational program that did not lead to a high school diploma, including 3 percent who left for a part time non-DOE GED program. Students in DOE GED programs are counted as still enrolled, as are those who completed home schooling and did not receive a diploma.
For a student to be counted as a discharge rather than a dropout, schools are required to document the new school or program at which the student has enrolled. A 2008 audit by the New York State Comptroller found that 4 out of a sample of 12 high schools understated their dropout rates by more than 5.0 percentage points. The audit concluded that a major reason for the discrepancy was students recorded as discharges by DOE, despite a lack of appropriate documentation that the students actually transferred to other schools or programs. An additional 2009 report from the state Comptroller, which sampled 500 of the 17,025 discharged students from the class of 2008 cohort, found that 14.8 percent were incorrectly classified as discharges rather than dropouts. Despite determining that some dropouts were misclassified, the Comptroller concluded that the effect was not large and that the overall graduation rate reported by the DOE was generally accurate. To the extent that this issue persisted for the class of 2009, students who are improperly classified by the DOE as discharges without proper documentation will still appear as discharges in the data available to IBO. These students would inflate both the graduation rate in this report and the official DOE graduation rate.
When Do Students Enter and Leave the System?
Over 90 percent of the cohort entered high school as first time ninth graders in the 2005-2006 school year. An additional 5,056 students entered as 10th graders the following year, decreasing to less than 700 entering as 12th graders in the final year. Table 3 shows that this pattern is similar across the major four-year outcomes, with a slightly higher proportion of graduates and GED recipients entering in the first year as compared with discharges and students who were still enrolled.
|
Table 3 Class of 2009 Cohort, Year Entered New York City High School |
||||||||||
| Graduates | Discharges | Still Enrolled | Dropouts | GED | ||||||
| Number | Percent | Number | Percent | Number | Percent | Number | Percent | Number | Percent | |
| 2005-2006 | 44,098 | 92.4% | 15,361 | 89.3% | 13,521 | 89.3% | 7,834 | 91.8% | 1,106 | 94.0% |
| 2006-2007 | 2,013 | 4.2% | 1,274 | 7.4% | 1,148 | 7.6% | 560 | 6.6% | 61 | 5.2% |
| 2007-2008 | 1,516 | 4.2% | 478 | 2.8% | 366 | 2.7% | 129 | 1.5% | 9 | 0.8% |
| 2008-2009 | 439 | 0.9% | 80 | 0.5% | 103 | 0.7% | 14 | 0.2% | 0 | 0.0% |
| Total | 47,706 | 100.0% | 17,193 | 100.0% | 15,138 | 100.0% | 8,537 | 100.0% | 1,176 | 100.0% |
| SOURCE: IBO analysis of Department of Education data on individual student records | ||||||||||
Students who left the school system during high school did so for a variety of reasons throughout the entire four-year period. Table 4 tracks members of the class of 2009 who left the New York City public school system over time by their specific dropout or discharge code. Twelve percent of the analysis cohort—students who were not discharged—dropped out. Several hundred students drop out each semester for the first two years, with the number of students dropping out reaching 1,000 by the first semester of the third year. Just over half of all dropouts do so in the fourth year, consistent with the legal requirement that students complete the school year in which they turn 17. More than 85 percent of these students left school as standard “voluntary” dropouts. Most of the remaining dropouts are those who ceased attending school without providing a known address. In such cases, an investigation is undertaken by an attendance teacher, with the school principal required to approve the steps taken to locate the student.
|
Table 4 Class of 2009 High School Cohort, Dropout and Discharge Timing |
||||||||
| 9/05- 12/31/05 |
1/1/06- 6/30/06 |
7/1/06- 12/31/06 |
1/1/07- 6/30/07 |
7/1/01- 12/31/07 |
1/1/08- 6/30/08 |
7/1/08- 12/31/08 |
1/1/09- 9/1/09 |
|
| Dropouts | ||||||||
| Full-time employment certificate |
* | * | 10 | 12 | 26 | 23 | 26 | 6 |
| Address unknown after investigation by attendance teacher |
236 | 65 | 82 | 29 | 107 | 67 | 91 | 20 |
| Met requirements at non-diploma institution, no diploma |
0 | * | 0 | * | 0 | * | 0 | * |
| Enrolled in business,
trade, vocational, training program |
0 | 1 | 2 | 3 | 10 | 21 | 19 | 16 |
| Military service | 0 | 0 | * | 0 | 0 | * | * | 0 |
| Non-DOE part-time GED program |
1 | 2 | 8 | 7 | 19 | 54 | 92 | 81 |
| Voluntary withdrawal after 20 consecutive absences |
24 | 112 | 237 | 507 | 858 | 1,481 | 2,006 | 2,121 |
| Voluntary withdrawal due to pregnancy |
0 | 0 | * | 0 | 9 | 7 | 10 | 16 |
| TOTAL | 264 | 186 | 342 | 559 | 1,029 | 1,656 | 2,246 | 2,225 |
| Discharges | ||||||||
| NYC Parochial School |
1,895 | 38 | 191 | 23 | 99 | 16 | 50 | 5 |
| NYC Private School | 473 | 23 | 148 | 44 | 187 | 108 | 123 | 81 |
| Institutionalized (Non-DOE) |
24 | 35 | 55 | 67 | 115 | 124 | 119 | 123 |
| School Outside NYC |
2,259 | 1,043 | 2,464 | 1,151 | 2,300 | 847 | 1,591 | 630 |
| Deceased | * | * | * | * | 6 | 9 | 8 | 31 |
| College early admission without graduation |
2 | 0 | 15 | 15 | 12 | 38 | 49 | 42 |
| Aged out over 21 years old (classifed as dropout in 2010) |
0 | 0 | * | * | 9 | * | 16 | 17 |
| Non-DOE full-time GED program |
3 | 10 | 6 | 13 | 36 | 50 | 80 | 76 |
| Transferred to charter school |
0 | 0 | 48 | 0 | 95 | 0 | 59 | 0 |
| TOTAL | 4,660 | 1,152 | 2,929 | 1,318 | 2,859 | 1,193 | 2,095 | 987 |
| SOURCE: IBO analysis of Department of
Education data on individual student records NOTE: *Counts of less than 5 have been suppressed to protect student privacy. |
||||||||
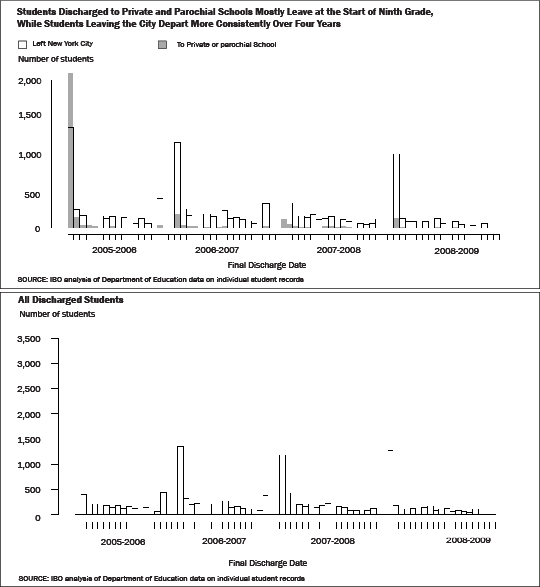
More than one-fourth of all students who were eventually discharged left in the first semester of their first high school year, with nearly all of them going to parochial or private school or to schools outside the city. More than 80 percent of the 2,317 students who transferred to parochial schools left in the first semester. The 1,187 students who transferred to private schools followed a similar but less pronounced pattern, with about 40 percent leaving in the first semester and between 25 students and 150 students leaving in each subsequent semester. Students who left the city—the largest discharge category—did so on a much more consistent basis, with between 3,100 and 3,600 leaving each year for the first three years and about 2,200 leaving in the final year.
Not only was the first semester of high school the most common time for students to be discharged, but most of these students were discharged at the very beginning of that semester. The figure at the top of this page provides a more detailed account of when students were discharged from city schools. Many of these students were officially enrolled at city public schools for just a few days before ending up at private and parochial schools. A closer look at students who left the city shows a much more stable pattern over the four-year period. Students are most commonly classified as discharges out of the city at the start of each school year as they fail to show up at school in the fall, with a smaller but fairly constant number leaving during the rest of the year. By contrast, students who were discharged to private or parochial schools largely did so at the start of the first year of high school, particularly those discharged to parochial schools.
How Do High School Outcomes Vary by Demographic Group?
Examining some of the demographic characteristics of members of the 2009 cohort reveals significant differences between graduates, discharges, and dropouts in terms of family income, place of birth, and ethnicity. Students receiving free lunch graduate at lower rates than students who receive reduced price lunch or pay full price based on their family income information. Immigrant students graduate at a slightly higher rate than U.S.-born students overall, but students from Central and South America, Mexico, and the Caribbean were substantially less likely to graduate. White and Asian students were much more likely to graduate than black and Hispanic students.
Graduation Rates by Family Income. IBO uses school lunch status as a gauge of students’ family income level. To receive free lunch students must be at or below 130 percent of the federal poverty line, with students between 130 percent and 185 percent of the poverty line receiving a reduced price lunch. Some students who pay full price for their lunch do so because their family income makes them ineligible, while others pay full price because they did not return the school lunch form, or had forms that were incomplete. Table 5 shows the graduation, dropout, and discharge rate for students in each of these categories.6 Although the discharge rate represents the percent of all students in the category who were discharged, the graduation and dropout rates represent the percentage of students who were not discharged and who graduated or dropped out.
|
Table 5 Class of 2209 Graduation, Dropout, and Discharge Rate By lunch category |
|||||
| Base Cohort |
Analysis Cohort |
Graduation Rate |
Dropout Rate |
Discharge Rate |
|
| Free | 60,011 | 51,723 | 63.3% | 11.7% | 13.9 |
| Full Price | 14,306 | 12,809 | 76.5% | 8.3% | 10.4% |
| Unknown | 9,581 | 2,953 | 42.7% | 37.3% | 69.2% |
| Reduced | 5,852 | 5,072 | 77.0% | 11.8% | 13.3% |
| TOTAL | 89,750 | 72,557 | 65.7% | 11.8% | 19.2% |
| SOURCE: IBO analysis of Department of Education data on individual student records | |||||
Students receiving free lunch based on their family’s income, about two-thirds of the full cohort, were slightly less likely to graduate than the citywide average of 65.7 percent and slightly more likely to drop out. Students paying full price for their lunch based on income had a graduation rate of 76.5 percent, more than 10 percentage points higher than the citywide average, and were also less likely to drop out of school. About 5,900 students receiving reduced price lunch were just as likely to graduate as those paying full price based on the form, with an even lower dropout rate. More than two-thirds of the nearly 10,000 students with missing or incomplete forms were discharged from the school system, consistent with the fact that many discharged students left school at the beginning of the first year and therefore had less time to return a form. However, the students with missing forms and data who were not discharged graduated at a very low rate, and were almost as likely to drop out as they were to graduate.
Graduation Rates by Place of Birth. On average, immigrant students graduated at a slightly higher rate than students born in the United States. Foreign-born students as a whole also dropped out and were discharged at a rate similar to U.S.-born students. However, these similarities mask wide variations in outcomes by country of origin. Table 6 shows graduation, dropout, and discharge rates by country of origin. Students from Asia, Europe, and Africa were far more likely to graduate than U.S.-born students and less likely to drop out. Conversely, students from the Caribbean, Central and South America, and Mexico were less likely to graduate than U.S.-born students, with students from Central America and Mexico having much higher dropout rates. Among Central American and Mexican-born students, the graduation rate was less than 50 percent. Almost all the students from U.S. Territories were born in Puerto Rico, and more than one in three were discharged. Of those who were not discharged, less than half graduated and almost a quarter dropped out.
|
Table 6 Class of 2009 Graduation, Dropout, and Discharge Rate By country of origin |
|||||
| Base Cohort |
Analysis Cohort |
Graduation Rate |
Dropout Rate |
Discharge Rate |
|
| U.S. Born | 63,900 | 51,756 | 65.6% | 11.7% | 19.0% |
| Born Outside U.S. | 24,675 | 20,029 | 67.1% | 11.5% | 18.8% |
| U.S. Territories | 1,005 | 662 | 48.3% | 24.6% | 34.1% |
| Unknown | 170 | 110 | 60.9% | 22.7% | 35.3 |
| Americas | |||||
| United States | 63,900 | 51,756 | 65.5% | 11.7% | 19.0% |
| Carribean | 8,529 | 6,823 | 61.3% | 13.6% | 20.0% |
| South America | 3,477 | 2,863 | 63.7% | 11.6% | 17.7% |
| Mexico | 1,240 | 954 | 42.5% | 24.8% | 23.1% |
| U.S. Territories | 1,005 | 662 | 48.3% | 24.6% | 34.1% |
| Central America | 748 | 575 | 49.7% | 22.8% | 23.1% |
| Canada | 144 | 104 | 70.2% | 11.5% | 27.8% |
| Asia | |||||
| East Asia | 3,469 | 2,874 | 72.2% | 9.1% | 17.2% |
| South Asia | 2,445 | 2,047 | 79.5% | 5.5% | 16.3% |
| West Asia- Middle East |
443 | 289 | 69.9% | 11.8% | 34.8% |
| Southeast Asia | 438 | 361 | 77.6% | 6.6% | 17.6% |
| Central Asia | 216 | 181 | 81.8% | 5.0% | 16.2% |
| Europe | |||||
| Eastern Europe | 1,558 | 1,326 | 79.8% | 7.2% | 14.9% |
| Southern Europe | 530 | 447 | 77.9% | 10.7% | 15.7% |
| Northern Europe | 148 | 115 | 75.7% | 9.6% | 22.3% |
| Western Europe | 113 | 69 | 85.5% | 7.2% | 38.9% |
| Africa | |||||
| West Africa | 836 | 711 | 76.8% | 6.0% | 13.9% |
| North Africa | 191 | 164 | 82.3% | 6.1% | 14.1% |
| East Africa | 64 | 56 | 82.1% | 5.4% | 12.5% |
| Middle Africa | 56 | 43 | 72.1% | 9.3 | 23.2% |
| Southern Africa | 15 | 11 | 91.7% | 0.0% | 20.0% |
| Oceania | 25 | 15 | 73.3% | 0.0% | 40.0% |
| SOURCE: IBO analysis of Department of Education data on individual student records | |||||
Graduation Rates by Race and Ethnicity. There were also differences when considering race and ethnicity. A large achievement gap in graduation outcomes exists between black and Hispanic students—the largest groups within New York City schools—and white and Asian students. Table 7 shows that while about 80 percent of white and Asian students graduate, the graduation rate was 62 percent for black students and 59 percent for Hispanic students. Black and Hispanic students were also more likely to be discharged, and were twice as likely as their Asian classmates to drop out.
| Table 7 Class of 2009 Graduation, Dropout, and Discharged Rate By ethnic category |
|||||
| Base Cohort |
Analysis Cohort |
Graduation Rate |
Dropout Rate |
Discharge Rate |
|
| Hispanic | 33,652 | 27,171 | 59.0% | 14.9% | 19.3% |
| Black | 29,638 | 24,447 | 62.0% | 11.8% | 17.5% |
| Asian | 12,542 | 10,871 | 80.3% | 6.0% | 13.3% |
| White | 11,235 | 9,395 | 79.2% | 8.1%1 | 16.4% |
| TOTAL | 87,067 | 71,884 | 65.9% | 11.6% | 17.4% |
| SOURCE: IBO analysis of Department of Education data on individual student records | |||||
While U.S. born white students graduated at roughly the same rate as white students born outside the U.S., Asian students born in the U.S. were over 10 percentage points more likely to graduate than Asian immigrants. Black and Hispanic students born in the U.S. had nearly identical graduation outcomes, but Hispanic immigrants were less likely to graduate than their U.S.-born counterparts while black immigrants were 8 percentage points more likely to earn a diploma.7 Table 8 shows all graduation outcomes disaggregated by both ethnic category and immigration status.
|
Table 8 Class of 2009 Graduation, Dropout, and Discharge Rate By ethnic category and immigration status |
|||||
| Base Cohort |
Analysis Cohort |
Graduation Rate |
Dropout Rate |
Discharge Rate |
|
| U.S. Born | |||||
| Hispanic | 23,383 | 19,324 | 60.4% | 14.0% | 17.4% |
| Black | 24,318 | 20,082 | 60.7% | 12.3% | 17.4% |
| Asian | 5,493 | 4,974 | 87.0% | 3.5% | 9.4% |
| White | 8,197 | 6,915 | 79.4% | 8.1% | 15.6% |
| Immigrant and U.S. Territories | |||||
| Hispanic | 10,160 | 7,842 | 55.8% | 17.1% | 22.9% |
| Black | 5,195 | 4,347 | 68.3% | 9.4% | 16.3% |
| Asian | 7,024 | 5,877 | 74.6% | 8.0% | 16.3% |
| White | 2,961 | 2,435 | 78.7% | 8.1% | 17.8% |
| SOURCE: IBO analysis of Department of Education data on individual student records | |||||
How Often Do Students Attend School During Their High School Careers?
Students who eventually graduated had stable and relatively high attendance rates throughout the four-year period. As shown in Table 9, the median graduate had an attendance rate above 93 percent all four years, declining only slightly in the fourth year.8 Attendance was lower and declined over time for all non-graduates. For students who eventually dropped out, attendance was very low from the start and declined sharply, suggesting that many of these students were never fully engaged in high school. The median dropout who was enrolled in year four (2008-2009) attended school less than 1 day out of every 3 days during that year. Similarly, students who were discharged had lower attendance rates than graduates in every year, and those that had not left by the fourth year were barely attending every other day. Students who were still enrolled after four years also had a lower attendance rate than graduates from the start, but their attendance rates declined far less than the other non-graduates over the years.
| Table 9 Class of 2009 Attendance By four-year outcome |
||||||||||
| Graduates | Dropouts | Discharges | Still Enrolled | GED | ||||||
| Percent | Number | Percent | Number | Percent | Number | Percent | Number | Percent | Number | |
| 2005-2006 | ||||||||||
| Mean Rate | 93.5% | 43,665 | 65.0% | 7,535 | 75.0% | 11,808 | 83.4% | 13,218 | 71.2% | 1,080 |
| Median Rate |
95.8 | 43,665 | 73.5% | 7,535 | 86.6% | 11,808 | 88.6% | 13,281 | 78.4% | 1,080 |
| 2006-2007 | ||||||||||
| Mean Rate | 94.0% | 45,659 | 55.9% | 7,505 | 70.3% | 8,956 | 80.2% | 14,276 | 63.8% | 1,122 |
| Median Rate |
96.5% | 45,659 | 60.9% | 7,505 | 81.7% | 8,956 | 86.5% | 14,276 | 69.5% | 1,122 |
| 2007-2008 | ||||||||||
| Mean Rate | 93.4% | 46,027 | 42.9% | 6,429 | 62.3% | 5,309 | 74.7% | 14,391 | 55.3% | 1,056 |
| Median Rate |
95.9% | 46,027 | 42.1% | 6,429 | 71.5% | 5,309 | 81.3% | 14,391 | 57.5% | 1,056 |
| 2008-2009 | ||||||||||
| Mean Rate | 91.0% | 46,813 | 34.7% | 3,640 | 53.1% | 2,080 | 68.6% | 15,038 | 53.8% | 770 |
| Median Rate |
93.5% | 46,813 | 31.8% | 3,640 | 56.9% | 2,080 | 75.1% | 15,038 | 55.9% | 770 |
| Total in Base Cohort |
47,706 | 8,537 | 17,193 | 15,138 | 1,176 | |||||
|
SOURCE: IBO analysis of
Department of Education data on individual student
records |
||||||||||
How Well Prepared Were Students Before High School?
Within the cohort there were large differences in student achievement prior to entering high school, based on eighth grade test scores. Fifty-seven percent of students who eventually graduated entered high school meeting proficiency standards (levels 3 and 4) in math, with 46 percent proficient in English Language Arts (ELA). In contrast, just 15 percent of students who would eventually drop out met eighth grade proficiency standards in math and only 13 percent met standards in ELA. In math, more than a third of students who dropped out were at the lowest level of proficiency in eighth grade. Table 10 shows the share of students at each proficiency level as eighth graders, across the major four-year outcome categories. Eighth grade proficiency levels for students who were still enrolled after four years were only modestly higher than those of students who dropped out, just 5 percentage points higher in math and 3 percentage points higher in English. Students who were eventually discharged from the system had higher proficiency levels than those who dropped out and those who were still enrolled after four years, but were far less likely to be proficient than graduates. Among students who were discharged, just 29 percent had been meeting ELA standards in eighth grade, with 35 percent meeting standards in math.
| Table 10 Class of 2009 Eighth Grade Performance By four-year outcome |
||||||||||
| Graduates | Dropouts | Discharges | Still Enrolled | GED | ||||||
| Percent | Number | Percent | Number | Percent | Number | Percent | Number | Percent | Number | |
| Math | ||||||||||
| Level 1 | 7.7% | 2,968 | 34.7% | 2,045 | 21.0% | 2,200 | 27.8% | 3,260 | 8.3% | 76 |
| Level 2 | 34.9% | 13,450 | 50.2% | 2,956 | 43.8% | 4,591 | 51.7% | 6,065 | 53.9% | 495 |
| Level 3 | 46.6% | 17,967 | 14.4% | 864 | 32.3% | 3,380 | 19.8% | 2,321 | 35.6% | 327 |
| Level 4 | 10.8% | 4,151 | 0.7% | 39 | 3.0% | 310 | 0.8% | 97 | 2.3% | 21 |
| English Language Arts | ||||||||||
| Level 1 | 2.7% | 975 | 13.5% | 737 | 7.6% | 712 | 10.8% | 1,147 | 1.7% | 15 |
| Level 2 | 51.1% | 18,448 | 73.8% | 4,018 | 63.8% | 6,018 | 73.5% | 7,798 | 61.7% | 561 |
| Level 3 | 38.0% | 13,723 | 12.1% | 656 | 25.4% | 2,398 | 14.9% | 1,581 | 33.7% | 307 |
| Level 4 | 8.2% | 2,972 | 0.6% | 35 | 3.3% | 307 | 0.8% | 85 | 3.0% | 27 |
| Total in Cohort | 46,706 | 8,537 | 17,193 | 15,138 | 1,176 | |||||
|
SOURCE: IBO analysis of
Department of Education data on individual student
records |
||||||||||
How Do Schools Vary in Terms of Discharge Rates?
About 19 percent of students in the class of 2009 were discharged citywide. Some subgroups of students are more likely to transfer out of city public schools than others, and these subgroups are likely to be disproportionately enrolled at some high schools. Substantial variation was identified between schools in the proportion of students discharged. Table 11 shows the distribution of discharge rates by school for general academic high schools and secondary schools (which house grades 9 through 12 with other grades, most typically grades 6 through 8) with a base cohort of more than 10 students.9 Half of these high schools had a discharge rate between 15.3 percent and 25.1 percent. However, 5.0 percent of the schools had discharge rates below 7.8 percent and an additional 5.0 percent discharged more than 33.0 percent of their base cohort.
No clear relationship was identified between discharge and graduation rates at individual high schools. Some high schools with very low discharge rates had very low graduation rates, while other schools had low discharge rates and high graduation rates. Similarly, high schools that discharged a very high proportion of their students include some schools with graduation rates below the citywide average as well as some with very high graduation rates.
For example, almost one-third of students whose last DOE school attended was Bronx Health Sciences were discharged, but 95 percent of those who were not discharged graduated.10 Among those for whom John F. Kennedy High School was the last school attended, almost 40 percent were discharged and almost 88 percent of those who remained graduated. Other schools with high graduation rates discharged very few students. For example, just 3 percent of students who last attended Gramercy Arts High School were discharged, but 85 percent of the rest graduated.
|
Table 11 Class of 2009 Cohort, Distribution of School Discharge Rates |
|
| 5th Percentile | 7.79% |
| 25th Percentile | 15.29% |
| Median | 20.49% |
| 75th Percentile | 25.14% |
| 95th Percentile | 33.04% |
| SOURCE: IBO analysis of
Department of Education data on individual student records |
|
Conclusion
Tracking four-year graduation outcomes for the class of 2009 from individual student data provides a nuanced view of a complex school system, where students flow in and out on a regular basis and follow different paths leading to different outcomes after four years. By publishing detailed discharge data for the first time, this study shows that the vast majority of students who were discharged from the school system were recorded as transferring to private and parochial schools and schools outside of New York City, with a large number doing so in the first semester of their first year. While about 19 percent of students were discharged, some high schools had discharge rates that were much higher or lower. Describing the variation in discharge rate between New York City high schools is instructive, but further study is needed before drawing conclusions about the extent to which these differences are caused by different policies at individual high schools or different characteristics of the students who tend to enroll in particular schools.
IBO’s analysis of individual student records resulted in an estimate of the overall graduation rate for the 2009 high school cohort that is very similar to the rate reported by DOE. Consistent with other reports, substantial gaps in graduation rates were found between black and Hispanic students and their white and Asian classmates, as well as between poor and better-off students. We also found large differences among immigrant students based on their country of origin.
Students who eventually graduated were more likely than those who did not to be proficient in math and ELA when they started high school, based on their eighth grade state test scores, and attended high school more often and more consistently. Very few students who dropped out were proficient in math and ELA in eighth grade, and often had attendance rates dropping to levels low enough to suggest these students had effectively disengaged from school long before their official dropout date. Most students who eventually drop out begin the process of disengagement in their first year of high school. Some clearly never engage in high school at all.
While this study generally distinguished between students based on their status after four years, a subsequent report will detail the achievement patterns within these groups based on results from Regents examinations.
This report prepared by Asa Wilks
Endnotes
1http://schools.nyc.gov/oag/HSAcademicDataAudit/HighSchoolAcademicDataAuditReport.pdf
2The city’s “traditional” methodology is used primarily for historical comparison. New York State’s method of calculating graduation rates, also reported by DOE as the official graduation rate, relies on similar classifications but includes all special education and disabled students. Because the IBO cohort is limited to those who were general education students at some point in their high school careers, the city’s traditional methodology provides a more appropriate basis for comparison. The state’s methodology yields a graduation rate of 59 percent for the city’s class of 2009.
3Differences between the IBO and DOE calculations are primarily due to differences in which students were included in the cohort. IBO counts students who transferred to charter schools from public high schools as discharges, while DOE excludes them altogether. Students who ended the study period in an educational setting other than a traditional high school are excluded from the DOE calculation but included in the IBO cohort. Examples of such students include those who returned to a middle school or began a home schooling program.
4http://publicadvocategotbaum.com/pages/documents/HighSchoolDischargeReport_FINAL.pdf
5Although students who age out of the system after 21 are counted as dropouts as of 2010, these students were still classified as discharges for the class of 2009.
6Students were classified as receiving free lunch if they ever received free lunch during the four-year period. Students who received reduced price lunch at least once but never received free lunch were classified as reduced price lunch students. Students with a lunch status of unknown were missing the lunch form or had missing data in all years.
7While a substantial share of black immigrants came from Africa, the single largest group came from countries in the Carribean.
8The attendance rate is the percent of days enrolled students attended school.
9Students were assigned to schools based on the last school they had been enrolled in as of September 1, 2009. The Department of Education has a more nuanced criterion for assigning students to schools for accountability purposes.
10A recent New York Post article focused on the pattern of discharges at this school.