July 2012
Meeting State Education Standards?
Tracking Grade-to-Grade Achievement For a
Group of 46,400 Students


July 2012
Meeting State Education Standards?
Tracking Grade-to-Grade Achievement For a
Group of 46,400 Students
Summary
Parents, educators, and taxpayers all want to know if the city’s schools are increasing the share of students meeting educational standards. The city’s Department of Education typically assesses progress in raising proficiency rates by comparing scores on the state English Language Arts and math tests of this year’s third through eighth graders with last year’s.
While that approach will tell you how this year’s third graders are doing compared with last year’s third graders, it will not tell you how individual students are performing from one year to the next: if they are gaining, losing, or maintaining grade-level proficiency in English and math. In this report, IBO uses data on English Language Arts results provided by the education department to track the annual performance of more than 46,400 students from school year 2005-2006 through 2009-2010 as they moved from third grade through seventh grade. (Because of changes in the state scoring in 2009-2010, some of our comparisons were limited to sixth grade rather than seventh grade.) Among our findings:
IBO also sought to identify any shifts in the achievement gap between students of different racial and ethnic backgrounds in the cohort we examined. We found little evidence of a narrowing of the achievement gap between 2005-2006 and 2009-2010, except for a decline of 3 percent between Hispanic and white students. Gaps between Asian students and each of the other ethnic groups widened.
Background: The Value of Longitudinal Analysis
Parents, educators, and taxpayers alike want to know if public school students are making progress in developing the underlying skills they will need as they advance in school and enter the workplace. The Department of Education (DOE) traditionally attempts to answer this question by presenting one-year snapshots of student achievement, meant to answer the question: How are this year’s third graders through eighth graders doing compared with last year’s? In this report, we take a different approach by looking at the same children over time and ask the question: How did individual students perform this year compared with last year and the year before? Increasingly, schools and educators are being held responsible for the year-to-year change in the achievement scores of individual students, yet there has been no public report of the school system’s overall performance on this account.
For this report, IBO examined the test records of 46,419 New York City students, tracking their annual performance over five years (school year 2005-2006 through 2009-2010) as they progressed from third grade to seventh grade. The data follow them from third grade, the first year they are required to take statewide English Language Arts (ELA) and math tests, until seventh grade. IBO derived information for this longitudinal study from student level files maintained by the Department of Education and provided to IBO.
The number of elementary and middle school students tested normally varies from year to year and grade to grade. Each year students enter or leave the test population with the arrival of new test-eligible youngsters and the departure of others. Note that in the grades studied in this paper—third through seventh—students who leave are generally not “drop-outs” but instead are transferring to a private or parochial school or moving to another school district. Absence from school is another factor that removes students from the testing pool. There are also shifts in the numbers due to exclusions based on language or special education status. For example, in 2007 the federal government required that more English-language learners be tested. As a result, there were many fewer exemptions or waivers granted to English-language learners and this boosted the size of the group subject to testing citywide.
In some cases, the influence of changes in student population on overall performance measures is hard to predict. As the composition of the group varies over time there will be a certain amount of variation in outcomes that has little to do with instruction—but instead reflects the net impact of the upward or downward tendency each change in the make-up of the population being tested has on the exam results.
Studying the same students longitudinally has the benefit of removing a large source of variation in outcomes—namely, changes in the make-up of the group whose performance is being examined. But eliminating such unknown and unwanted “noise” from the analysis comes at a cost. The factors that enable a stable cohort of students to be identified and evaluated over five years will also render it less than fully representative of the entire population of students in those grades. Nonetheless, longitudinal analysis can enhance our understanding of the performance of a substantial portion of the students who took these tests in the five years.
The longitudinal design allowed results to be seen from perspectives not generally presented by the DOE in announcements about student outcomes and made it possible to investigate:
This work used the reported performance levels and scale scores each student received on the annual statewide exams. Performance level thresholds and the transformation of raw scores on the tests to scale scores are determined by the New York State Education Department (SED). It should be noted that our approach could not be used by the DOE or SED in their annual report on student outcomes because of the need to exclude students who have not been tested in consecutive years. Thus, this work is intended as a complement to, rather than a substitute for, the official reports of test scores.
Our Analytic Cohort
Department of Education files were searched to identify students who had complete ELA test data from school year 2005-2006 through 2009-2010. Any student who was not tested in any individual year was dropped from our analysis. This yielded 49,333 students from an original group of 76,437 third graders who had been tested at least once in grade 3 in 2005-2006 or grade 4 in 2006-2007 and so on, up to grade 7 in 2009-2010. Upon further inspection, an additional 2,914 of these students were excluded because they had been tested out of their grade level at least once during the five-year period, confounding interpretation of the results. Thus, this report is based upon the performance patterns of a cohort of 46,419 students, 60.7 percent of the students tested at least once in these grades in these years. Each of the students in the cohort took the state tests for five consecutive years and advanced to the next grade level each year, beginning in grade 3 and ending in grade 7. The benefits inherent in this analysis come with a trade-off: The survivors, having gotten past these restrictions, will differ in character from those who did not and may yield findings that do not generalize to the citywide test population.
Given how the cohort was assembled, it is important to understand how students in the cohort differ from the population of students being tested and what these differences imply for IBO’s findings. Table 1 compares characteristics of the cohort to all citywide test takers. The make-up of the cohort in 2005-2006 is described by gender and ethnicity as well as by special education status and English proficiency when students were third graders. Corresponding breakdowns are given for all students who took the ELA test in 2005-2006.
While the analytic cohort is similar to the citywide population in terms of gender and ethnicity, it differs in terms of the percentage of students with special needs and English-language learners. The 50:50 female to male ratio of the cohort is close to the 49:51 citywide ratio of students in grade 3. The ethnic mix of the cohort appears to match the percentages observed in the overall school year 2005-2006 test population, with each ethnic group in the cohort within 1 percentage point of its representation among all test takers. Black and Hispanic students make up 70.6 percent of the cohort; white and Asian students are the other 29.4 percent. We observe larger differences between our analytic cohort and the overall population in terms of the percent of students with special education needs and students classified as English-language learners. We lose some students with special needs from our cohort because they are tested off grade level if their Individualized Education Plan calls for that. Some English-language learners are exempt from testing upon their entry to the school system and therefore are not included in our cohort.
|
Table 1: Composition of the Cohort Compared with All
Students Tested Citywide, 2005-2006 Through 2008-2009 |
||||||
|
|
Cohort |
All Students |
||||
|
|
2005-2006 Grade 3 |
2005-2006 Grade 3 |
2008-2009 Grade 6 |
|||
|
Female |
23,100 |
49.8% |
30,109 |
49.0% |
33,052 |
48.6% |
|
Male |
23,319 |
50.2% |
31,394 |
51.0% |
34,950 |
51.4% |
|
Total |
46,419 |
100.0% |
61,503 |
100.0% |
68,002 |
100.0% |
|
Asian |
6,234 |
13.5% |
7,661 |
12.5% |
9,776 |
14.4% |
|
Hispanic |
15,774 |
34.2% |
20,879 |
34.1% |
21,368 |
31.6% |
|
Black |
16,795 |
36.4% |
22,958 |
37.5% |
27,076 |
40.0% |
|
White |
7,354 |
15.9% |
9,688 |
15.8% |
9,434 |
13.9% |
|
Total |
46,157 |
100.0% |
61,186 |
100.0% |
67,654 |
100.0% |
|
General Ed |
42,579 |
92.2% |
52,245 |
84.9% |
54,976 |
80.8% |
|
Special Ed |
3,609 |
7.8% |
9,259 |
15.1% |
13,026 |
19.2% |
|
Total |
46,188 |
100.0% |
61,504 |
100.00% |
68,002 |
100.0% |
|
ELL |
990 |
2.1% |
2,233 |
3.6% |
7,631 |
11.2% |
|
EP |
45,198 |
97.9% |
59,271 |
96.4% |
60,371 |
88.8% |
|
Total |
46,188 |
100.0% |
61,504 |
100.0% |
68,002 |
100.0% |
|
SOURCES: IBO analysis
of Department of Education data,
http://schools.nyc.gov/Accountability/data/TestResults/ELAandMathTestResults NOTE: Totals differ because some student records were missing information on gender, ethnicity, special education status and language proficiency. |
||||||
Overall, the analytic cohort performed somewhat better than the entire group of students taking the ELA exams. The cohort is a higher scoring group than the general test population. It is more stable in terms of availability for testing over time and ability to remain on grade level (i.e., not be held back) from one year to the next. The net impact on test performance of factors related to students staying in the cohort appears to be positive.1
|
Table 2: New York City Results on the New York State
English Language Art Tests, Grades 3-7, 2005-2006
Through 2009-2010 |
|||||||
|
|
|
Students in Cohort Compared to All Students
Tested in
Terms of Performance Level and Scale Score |
|||||
|
|
|
Number Tested |
Percent Meeting Standards |
Mean Scale Score |
|||
|
Year |
Grade |
All Students |
Cohort |
All Students |
Cohort |
All Students |
Cohort |
|
2005-2006 |
3 |
61,478 |
46,419 |
61.5% |
65.0% |
661 |
665 |
|
2006-2007 |
4 |
69,933 |
46,419 |
56.0% |
63.4% |
654 |
661 |
|
2007-2008 |
5 |
68,782 |
46,419 |
69.2% |
75.6% |
661 |
665 |
|
2008-2009 |
6 |
68,001 |
46,419 |
72.6% |
78.5% |
662 |
666 |
|
2009-2010 |
7 |
68,377 |
46,419 |
38.2% |
45.1% |
661 |
666 |
|
SOURCE: IBO analysis of
Department of Education data
NOTE: Until 2009
students needed to obtain scale scores of 650 or above
to meet or exceed the New York State standard. In 2010,
SED recalibrated the test; seventh graders had to reach
a scale score of 664 to meet the standard. |
|||||||
A higher percentage of students in the cohort meet state ELA proficiency standards than in the test population. The difference in percentage points between the cohort and all tested students is smallest in third grade in 2005-2006 (3.5 percentage points). For the next three years, the percentage of cohort students at and above Level 3 (“meeting the standard”) is 7.4, 6.4, and 5.9 points higher than the citywide results. In school year 2009-2010, SED raised the cutoff score needed for students to be deemed proficient. This tidal change sharply reduced the percentage meeting the standard citywide on the grade 7 ELA test (38.2 percent). The cohort’s grade 7 results in terms of the revised standard also dropped precipitously but were 6.9 percentage points higher than for the city as a whole.
Looking at Individual Student Performance Over Time
Studying the analytic cohort affords an opportunity to draw a more dynamic picture of what progress looks like. What happened to the Level 1s over the four years? How steady was the advancement of Level 2s to becoming Level 3? How often did Level 3s regress to the Level 2 category? Do Level 4s hold on to their high level of proficiency over time?
Our analysis of changes in individual performance scores concentrates on the 2005-2006 to 2008-2009 period. This is because the State Education Department significantly changed the scale score needed to be considered Level 3 for the 2009-2010 tests. This change sharply reduced the number of students reaching Level 3 and introduced a discontinuity in the data that makes it difficult to interpret trends in proficiency over the full five-year period.
|
Table 3: English Language Arts Performance Levels,
Frequencies 2005-2006 Through 2008-2009 |
|||||
|
|
2008-2009 Level |
Total |
|||
|
2005-2006
Level |
1 |
2 |
3 |
4 |
|
|
1 |
30 |
2,900 |
786 |
|
3,717 |
|
2 |
|
4,924 |
7,530 |
62 |
12,516 |
|
3 |
|
2.129 |
22,790 |
2,752 |
27,671 |
|
4 |
|
15 |
1,604 |
896 |
2,515 |
|
Total |
30 |
9,969 |
32,710 |
3,710 |
46,419 |
|
Table 3A:
English Language Arts
Performance Levels,
Percentages,
2005-2006 Through
2008-2009 |
|||||
|
|
2008-2009 Level |
Total |
|||
|
2005-2006
Level |
1 |
2 |
3 |
4 |
|
|
1 |
0.1% |
6.2% |
1.7% |
0.0% |
8.0% |
|
2 |
|
10.6 |
16.2% |
0.1 |
27.0% |
|
3 |
|
4.6 |
49.1% |
5.9 |
59.6% |
|
4 |
0.0 |
0.0 |
3.5% |
1.9 |
5.4% |
|
Total |
0.1% |
21.5% |
70.5% |
8.0% |
100.0% |
|
SOURCE: IBO analysis of
Department of Education data |
|||||
Overall, a picture of modest improvement amidst overall consistency emerges. While 30.1 percent of all students improved by at least one performance level over the four test administrations from 2005-2006 through 2008-2009, 61.7 percent ended sixth grade at the same performance level they attained upon first being tested in grade 3. Only 8.1 percent of all students ended up at a lower level than where they began. These results are displayed in tables 3 and 3A.
Clear differences can be seen in the patterns of students who began at each of the four performance levels. The bulk of the improvement in individual proficiency scores came from those who were initially scored as Level 2 (partially meeting standards), while the overall consistency noted results from the large share of students who began as Level 3s (meeting standards) and were the least likely to move to a different proficiency level over four years.
Students Who Entered the Cohort as Level 1s. Just 8.0 percent of the cohort—3,717 students—were scored as Level 1s when they took their first state test in school year 2005-2006 as third graders. All but 30 of these students improved their performance level. Seventy-eight percent improved to Level 2 and 21.1 percent made it to Level 3 by 2008-2009.
Of the 64 possible paths that could be taken by students who began as Level 1s (for example, from Level 1 to 2 to 3 to 3, or from Level 1 to 2 to 2 to 2 over four years) only 21 paths were actually taken. Table 4 presents these sequences in order of frequency. Over two-thirds (67.7 percent) of the cohort that began as Level 1s showed forward movement on the ELA without regressing by grade 6, thereby beginning to meet part of the standards (Level 2), although they had not reached proficiency (Level 3). The three most common paths taken by students who started out at Level 1 was 1-122, 1-222, and 1-112. In the words that define the state standards, it appears these students start out unable to meet the learning standards and then partially meet them in grades 4, 5, or 6.
Another 16.7 percent of the group achieved proficiency according to the state standards by grades 5 or 6 (patterns of 1-223, 1-123 and 1-233). The steady progress of this small group of students is consistent with the notion that academic growth occurs slowly and incrementally.
The next most common paths, 1-232 and 1-132, were taken by 7.7 percent. These patterns have third graders meeting the standards in the fifth grade only to fall back a year later.
|
Table 4: Students Who Started at Level One: English
Language Arts Performance Level Pathways Taken From
Grade 3, 2005-2006 Through Grade 6, 2008-2009
Ranked by frequency |
|||||
|
Path |
Frequency |
Percent |
Path |
Frequency |
Percent |
|
1-122 |
1,329 |
35.8% |
1-232 |
34 |
0.9 |
|
1-222 |
714 |
19.2 |
1-212 |
30 |
0.8 |
|
1-112 |
476 |
12.8 |
1-322 |
25 |
0.7 |
|
1-223 |
276 |
7.4 |
1-111 |
16 |
0.4 |
|
1-233 |
207 |
5.6 |
1-121 |
14 |
0.4 |
|
1-232 |
182 |
4.9 |
1-113 |
10 |
0.3 |
|
1-123 |
136 |
3.7 |
1-312 |
4 |
0.1 |
|
1-132 |
105 |
2.8 |
1-213 |
3 |
0.1 |
|
1-333 |
70 |
1.9 |
1-342 |
1 |
0.0 |
|
1-133 |
49 |
1.3 |
1-343 |
1 |
0.0 |
|
1-332 |
35 |
0.9 |
|
|
|
|
SOURCE: IBO analysis of
Department of Education data
NOTE: 21 of 64 possible
paths were taken. n=3,717 |
|||||
Students who Entered the Cohort as Level 2s. There were 12,516 pupils who scored at Level 2, categorized as partially meeting state standards, based on their initial test results in 2005-2006. It was the performance of these students that largely explains the increase in the percentage of all students attaining Level 3. Over half (53.7 percent) of the students in our cohort whose performance level improved between 2005-2006 and 2008-2009 were students who moved from Level 2 to Level 3. In our cohort, 60.1 percent of students who began at Level 2 in the third grade finished grade 6 at Level 3; 39.3 percent ended up at Level 2.
In all, these students followed 27 different year-to-year paths over the four years. Among these paths, 53.9 percent of the students who started at Level 2 made it to Level 3 without regressing over the four years (2-333, 2-233, and 2-223). Another 18.3 percent of students remained at Level 2 on each of the four tests and 14.8 percent attained Level 3 at some point but then regressed to Level 2. No students who started out as Level 2 ended up at Level 1 after the four years, reflecting the very low number of Level 1 scores on the 2008-2009 test.
|
Table 5: Students Who Started at Level Two: English Language Arts Performance Level Pathways Taken from Grade 3, 2005-2006 Through Grade 6, 2008-2009
Ranked by Frequency |
|||||
|
Path |
Frequency |
Percent |
Path |
Frequency |
Percent |
|
2-333 |
2,697 |
21.5% |
2-212 |
37 |
0.3 |
|
2-233 |
2,321 |
18.5 |
2-343 |
23 |
0.2 |
|
2-222 |
2,289 |
18.3 |
2-433 |
7 |
0.1 |
|
2-223 |
1,725 |
13.8 |
2-213 |
5 |
0.0 |
|
2-232 |
1,078 |
8.6 |
2-234 |
5 |
0.0 |
|
2-122 |
682 |
5.4 |
2-243 |
4 |
0.0 |
|
2-323 |
540 |
4.3 |
2-242 |
2 |
0.0 |
|
2-332 |
394 |
3.1 |
2-312 |
2 |
0.0 |
|
2-322 |
263 |
2.1 |
2-324 |
2 |
0.0 |
|
2-123 |
141 |
1.1 |
2-344 |
2 |
0.0 |
|
2-132 |
129 |
1.0 |
2-224 |
1 |
0.0 |
|
2-133 |
66 |
0.5 |
2-434 |
1 |
0.0 |
|
2-334 |
51 |
0.4 |
2-443 |
1 |
0.0 |
|
2-112 |
48 |
0.4 |
|
|
|
|
SOURCE: IBO analysis of
Department of Education data
NOTES: 27 out of 64
possible paths were taken. n=12,516 |
|||||
Students Who Entered the Cohort as Level 3s. The largest group in our analytic cohort is the 27,671 third graders who start out as proficient (Level 3) in third grade in 2005-2006, 59.6 percent of the entire cohort. In contrast to the students who started out at Level 2, the students who started at Level 3 in the third grade tended to stay put over the three subsequent years. Within this group, 82.4 percent ended sixth grade where they started, at Level 3. Only 9.9 percent improved to Level 4 in sixth grade, while 7.7 percent slid back to Level 2. Table 6 displays the details of their year-to-year moves.
The paucity of students who ever attained Level 4 after having started out at Level 3, combined with the large movement of students from Level 2 to Level 3 reported above, indicates that by this measure, the success of the city’s schools was concentrated on those students who started out below standards. Of all students in our analytic cohort who improved, 80.4 percent began at Level 1 or 2 compared with 19.6 percent who began at Level 3.
It is also worth noting that the design of the state ELA test and where the proficiency cut-offs are set has resulted in a small percentage of students achieving a Level 4. For example, in school year 2008-2009, 9.0 percent of sixth graders statewide achieved Level 4.
|
Table 6: Students Who Started at Level Three: English
Language Arts Performance Level Pathways Taken from
Grade 3, 2005-2006 Through Grade 6, 2008-2009
Ranked by frequency |
|||||
|
Path |
Frequency |
Percent |
Path |
Frequency |
Percent |
|
3-333 |
16,473 |
59.5% |
3-123 |
23 |
0.1 |
|
3-233 |
2,626 |
9.5 |
3-234 |
23 |
0.1 |
|
3-334 |
1,606 |
5.8 |
3-132 |
21 |
0.1 |
|
3-433 |
938 |
3.4 |
3-243 |
9 |
0.0 |
|
3-223 |
858 |
3.1 |
3-112 |
5 |
0.0 |
|
3-343 |
804 |
2.9 |
3-342 |
4 |
0.0 |
|
3-323 |
779 |
2.8 |
3-213 |
3 |
0.0 |
|
3-332 |
632 |
2.3 |
3-324 |
3 |
0.0 |
|
3-222 |
615 |
2.2 |
3-432 |
3 |
0.0 |
|
3-232 |
606 |
2.2 |
3-212 |
2 |
0.0 |
|
3-434 |
474 |
1.7 |
3-242 |
2 |
0.0 |
|
3-344 |
348 |
1.3 |
3-244 |
2 |
0.0 |
|
3-444 |
295 |
1.1 |
3-113 |
1 |
0.0 |
|
3-443 |
244 |
0.9 |
3-224 |
1 |
0.0 |
|
3-322 |
180 |
0.7 |
3-312 |
1 |
0.0 |
|
3-122 |
58 |
0.2 |
3-313 |
1 |
0.0 |
|
3-133 |
30 |
0.1 |
3-423 |
1 |
0.0 |
|
SOURCE: IBO analysis of
Department of Education data
NOTES: 34 out of 64
possible paths were taken. n=27,671 |
|||||
Students Who Entered the Cohort as Level 4s. Having begun on the highest rung by exceeding the state learning standards, the 2,515 students in this category (5.4 percent of the cohort) could only remain on top or move down. Unlike the students who started out at Level 3 and who largely remained there, the Level 4 students were less likely to maintain their position. As Table 7 indicates, only 7.9 percent of the students who started out at Level 4 scored at that same level on each of the four tests. In total, 35.7 percent of the original Level 4 students ended up at that same level; the rest declined, mostly to Level 3.
|
Table 7: Students Who Started at Level Four: ELA
Performance Level Pathways Taken from Grade 3,
2005-2006 Through Grade 6, 2008-2009
Ranked by frequency |
|||||
|
Path |
Frequency |
Percent |
Path |
Frequency |
Percent |
|
4-333 |
1,009 |
40.1% |
4-323 |
11 |
0.4 |
|
4-334 |
336 |
13.4 |
4-332 |
8 |
0.3 |
|
4-434 |
236 |
9.4 |
4-223 |
4 |
0.2 |
|
4-433 |
234 |
9.3 |
4-232 |
3 |
0.1 |
|
4-444 |
199 |
7.9 |
4-222 |
2 |
0.1 |
|
4-343 |
198 |
7.9 |
4-234 |
2 |
0.1 |
|
4-344 |
123 |
4.9 |
4-243 |
2 |
0.1 |
|
4-443 |
116 |
4.6 |
4-342 |
1 |
0.0 |
|
4-233 |
30 |
1.2 |
4-432 |
1 |
0.0 |
|
SOURCE: IBO analysis of
Department of Education data NOTES: 18 of 64 possible paths were taken. n=2,515 |
|||||
The “Achievement Gap”
Partitioning the cohort into racial and ethnic groups allows IBO to examine differences in achievement between groups and how these gaps have changed over time. Because this study follows the same cohort of students over the five years, analysis of the changes in the observed achievement gaps between groups does not need to account for differences in the group of students taking the state tests each year. Achievement gaps are expressed in terms of standard deviations (SD) in order to allow comparisons across different tests and different time periods. We find little evidence of progress in closing the achievement gaps between ethnic groups.
Methodology. The analysis in this section focuses on students’ scale scores rather than the proficiency scores. Using scale scores allows us to draw information from the entire distribution of scores rather than the cruder categorization into four proficiency categories. While the State Education Department altered the proficiency scoring for 2009-2010, the tests themselves were not altered and there was no significant change to the calculations of the underlying scale scores. Therefore, in this section we can utilize test results from all five years from school year 2005-2006 through 2009-2010. Scale scores convert raw scores on individual tests into values that are comparable from one year to the next within the same grade, despite the fact that different versions of the tests are prepared each year and test items vary in difficulty. Because these data are assumed to fall on a common scale within a grade over time, average scale scores and changes in their distribution can be compared over time to draw meaningful inferences about whether schools are improving in terms of performance within a grade. Note that because the state tests are not designed to measure individual students year-to-year progress, the scale scores cannot be compared from grade to grade.
Mean scale scores for Asian, Hispanic, black, and white students were obtained for each grade level. Although group mean scores are readily compared, more informative comparisons take into account how far the mean score for each group differs from the overall mean, with the difference expressed in standard units based on the overall distribution. A common statistic used in education research that permits such group comparisons is the “z-score.” To compute z-scores we used the mean scores for each subgroup and the mean score and standard deviation for all 46,419 students in the cohort. Each subgroup’s average is subtracted from the cohort’s, and the difference is divided by the SD. This weights each group on a common scale, measuring how far each group stands from the overall mean in units based on the standard deviation. The z-score has a mean of zero and a standard deviation of 1.0 under a normal distribution. Differences in achievement between two groups (“the achievement gap”) can be measured by subtracting one group’s z-score from the second group’s z-score.
|
Table 7a: Average Scale Score by Grade |
|||||
|
Ethnicity |
Grade 3 |
Grade 4 |
Grade 5 |
Grade 6 |
Grade 7 |
|
Asian |
684.69 |
681.02 |
681.11 |
682.50 |
683.55 |
|
Hispanic |
658.52 |
654.86 |
661.22 |
661.69 |
660.84 |
|
Black |
654.93 |
650.74 |
657.46 |
658.74 |
657.58 |
|
White |
684.10 |
679.32 |
679.39 |
676.21 |
679.46 |
|
Citywide |
664.76 |
660.73 |
665.39 |
665.71 |
665.60 |
|
Citywide SD |
38.94 |
35.99 |
29.46 |
26.40 |
29.22 |
|
Table 7b: Standard Scores (z-scores) by Grade |
|||||
|
Ethnicity |
Grade 3 |
Grade 4 |
Grade 5 |
Grade 6 |
Grade 7 |
|
Asian |
0.512 |
0.564 |
0.534 |
0.636 |
0.614 |
|
Hispanic |
-0.160 |
-0.163 |
-0.142 |
-0.152 |
-0.163 |
|
Black |
-0.252 |
-0.278 |
-0.269 |
-0.264 |
-0.274 |
|
White |
0.497 |
0.517 |
0.475 |
0.398 |
0.474 |
|
SOURCE: IBO analysis of
Department of Education data |
|||||
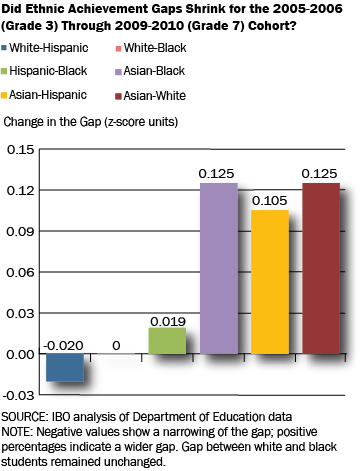
Reducing the achievement gap between students from different economic and socioeconomic backgrounds is a primary goal of school reform efforts in the city and across the country. Applying the steps outlined above we can determine whether intergroup gaps have grown wider or shrunk over the five years for this cohort of students as they progressed from grade 3 to grade 7. The change in the achievement gap between each of the ethnic pairings (measured in z-score units) is shown in the chart below.
Within the analytic cohort, the achievement gap between white and Hispanic students narrowed by 0.02 z-score units (-3.0 percent), while the gap between white and black students remained unchanged. On the other hand, gaps between Asian students and each of the other ethnic groups widened within the cohort by 0.10 z-score units or more; in percentage terms there were increases of 15.6 percent and 16.3 percent, respectively, in the Asian-Hispanic and the Asian-black gaps. The gap between Hispanic and black students also grew by 0.019 z-score units (21.0 percent). Over the five-year period there is a widening of the achievement gap separating Asian students from Hispanic, black, and white students. By grade 7, the gap between black and Hispanic students and white youngsters remains close to where it started in grade 3. The findings for this cohort of students indicate little evidence of a narrowing achievement gap.
These results would have looked somewhat different had our analysis ended with these students in grade 6 in 2008-2009. In that year, white students had average scale scores that were 3 points lower than their average score in 2009-2010. (See Table 7a.) Black and Hispanic students had scores that were very slightly higher than in the surrounding years. Thus, in 2008-2009, the achievement gaps between white and black students and between white and Hispanic students would have appeared smaller than we find in 2009-2010.
Conclusions
This report documents the achievement trajectory of a large group of New York City public school students on the state’s English language assessment. This group is higher performing than the entire student population because it only includes students who took the test in the appropriate grade for five consecutive years. The changes in the achievement levels we observed among these students differ depending on individual students’ initial achievement levels. Thirty percent of all students in our analytic group did improve at least one performance level between third and sixth grade. Half of the students whose performance improved started out at Level 2 and crossed the boundary of proficiency to Level 3.
Conversely, higher achieving students generally did not improve their level of performance. Over 82 percent of those who started out at Level 3 remained there. For students who start out at Level 4 there is no level to advance to, but 63 percent of this group dropped back to Level 3 by the end of grade 6.
These findings reflect both the performance of the city’s schools and the technical limitations of the state’s student testing program. Most importantly, the test used by the state is not vertically scaled. As a result, a student who earned a Level 3 two years in a row may have actually improved, declined, or stayed the same; the test is designed simply to inform us as to the child’s performance relative to the standard for their grade in a particular year.
Surprisingly, much of the debate about using longitudinal analysis of student test scores to assess schools and individual teachers has taken place without discussion of what the same comparisons suggest about the performance of the system as a whole. This report was meant to provide some of that context to the public.
A longitudinal analysis also allows us to look at variations in achievement among students of different racial and ethnic backgrounds in the cohort we have examined. Moving beyond the proficiency scores to the scale scores in order to assess the differences, we find little evidence of a significant narrowing of the achievement gap. While we observe a decline of 3 percent in the gap between Hispanic and white students between 2005-2006 and 2009-2010, we see no progress in reducing the white-black achievement gap and significantly greater separation between Asian students and the other ethnic groups as this cohort of students moved from grade 3 through grade 7.
This report prepared by consultant Fred Smith
Endnote
1When the cohort was in grade 4 in 2006-2007, there was a large increase in the test population, reflecting a spike of 8,640 in the number of English-language learners taking the test that year as the DOE complied with federal regulations requiring that English learners be tested. This contributed to the decline in reported proficiency for all students from grade 3 in 2005-2006 (61.5 percent) to grade 4 (56.0 percent). Since the cohort consisted of students who had test scores each year from 2005-2006 forward, its results were not affected by the policy change requiring more English-language learners to be tested.