
September 2012
Expansion and
Contraction
Budget Swings & Program Changes Mean City’s
Out-of-School Time Initiative Keeps Evolving
PDF version available here.
Summary
One of the major focal points of last spring’s negotiations over the city’s 2013 budget was a proposed reduction in the number of after-school program slots for New York’s children. The number of slots was set to fall by nearly half to 26,900 due to budget cuts and a revamping of the program known as Out-of-School Time. But with the City Council’s addition of $50.6 million for the program in 2013, the Council’s single largest addition of funds during the negotiations last spring, the number of after-school slots will exceed 56,600 this year—roughly 4,000 more than were available in 2012.
Since the inception of the Out-of-School Time program in 2005, when it was created as part of a Bloomberg Administration effort to streamline social services and lower costs, the program has grown into the city’s largest source of after-school services. But spending on the program and the number of slots available for youth have waxed and waned. In addition to funding changes there have also been changes in the program itself, most notably service enhancements beginning this year such as employing education specialists at program sites. This report traces the shifts in the program since its start. Among the report’s findings:
-
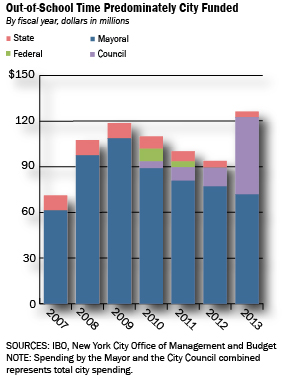
Out-of-School Time has been predominately funded with city dollars. City funding grew from $61 million in 2007 (its first full year of operation) to $108 million in 2009, and then fell to $90 million last year, including $12 million in Council funds.
-
With the Council’s funding this year, the program’s city-funded budget is $122 million out of a total budget of $126 million, including $4 million from the state.
-
The program’s capacity grew from 64,500 slots in 2007 to a peak of 78,500 in 2008. By 2012, a combination of rising costs and declining funds had reduced the number of slots to 52,600.
-
The City Council is providing 41 percent of Out-of-School Time funds this year, restoring programs at locations that would have been eliminated. Service providers funded with these dollars are not required to put in place the programmatic changes demanded under the Bloomberg Administration’s newly issued contracts. While the cost per slot under the new contracts averages $2,636, Council-funded slots will cost about one-third less on average.
The budget agreement between the Mayor and the Council can be seen as a compromise between creating a more service-intensive system at a higher cost per slot and preserving capacity. Since the Council funding is only for this year, the debate over these goals will likely be revisited soon.
This spring much of the discussion about the approaching fiscal year 2013 budget concerned the Out-of-School Time (OST) program in the Department of Youth and Community Development which provides after-school services for school-age children.1 As a result of budget reductions as well as a planned restructuring that will result in a more service intensive but costlier program, the capacity of the OST system was expected to shrink by nearly 50 percent from 52,600 to 26,900. While there was expected to be an overall net reduction in capacity of 25,700 slots under the restructuring, the actual number of slots scheduled for closing was significantly higher. This is because some of the programs losing funding were expected to be replaced by new programs developed as part of the restructuring.
In response to concerns about the loss of after-school services, as part of the 2013 Adopted Budget the City Council added $50.6 million to what the Mayor had budgeted in order to preserve nearly 30,000 slots that would have been discontinued under the restructuring. As a result, the OST program in 2013 will actually serve more children than it did in 2012.
The budget deal between the City Council and the Mayor will effectively create a two-tier system. The Council discretionary funds that were added will allow many of the current programs to continue to operate at a reimbursement rate similar to the rate they received in 2012, while DYCD will proceed with its plans to implement more service intensive programs at a significantly higher cost per slot. The agreement will result in the first expansion of the OST system since 2008.
This report looks at changes in OST funding and spending in the years since its inception, and the impact of these changes on the number of children served. The focus is on the rapid expansion of the OST system, and its subsequent contraction due to funding reductions and changes in program design. We use this history to provide context for the dramatic changes in store for OST in 2013.
Background
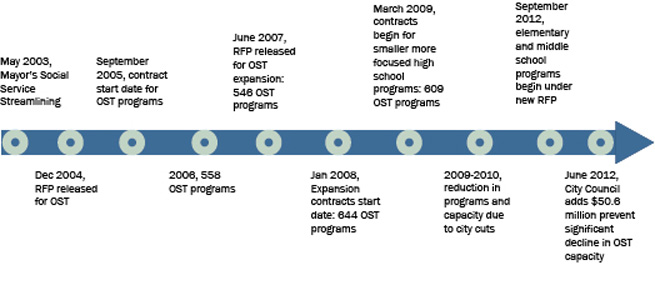
In his 2004 Executive Budget, as part of a larger plan to streamline social services, Mayor Michael Bloomberg proposed to transfer after-school day care services which were delivered by the Administration for Children’s Services (ACS) to the Department of Youth and Community Development (DYCD). At the time, ACS provided after-school care to about 18,000 children between the ages of 5 and 13 in privately run day care centers and home-based day care programs. DYCD ran separate school-based and center-based programs in the afternoons, although these programs tended to not be as structured as the ACS contracted programs. The Mayor proposed to take all 18,000 ACS after-school children and transfer them to a new school-based program under the auspices of DYCD, while expanding services to school-aged children throughout the city. The new after-school program was called Out-of-School Time, or OST.
Nine years later, much has changed. The Out-of-School Time program reached its peak size in 2008 with a budget of $107 million and a capacity to serve 78,500 youths. By 2012, however, as a result of budget cuts and program changes, OST had a total budget of about $95 million and a capacity to serve 52,600. In October 2011, DYCD released a Request for Proposals (RFP) to redesign the elementary and middle school programs, a change which was expected to further reduce the size of OST. With the implementation of the new programs under the RFP, the total OST budget in 2013 was expected to fall to $76 million, with a total capacity of only 26,900, a decrease in capacity of about two-thirds from its peak level. However, as part of the 2013 Adopted Budget the City Council added $50.6 million to the OST program, increasing the total budget, including state funds, to $126 million and the capacity to 56,600.
The Evolution of the Out-of-School Time Program.
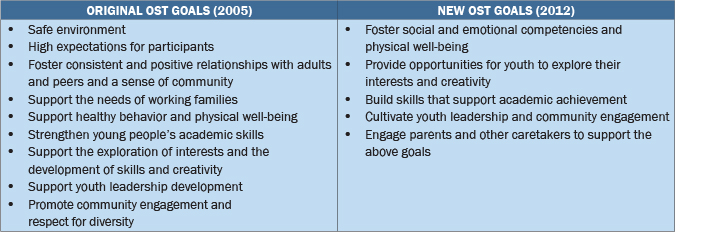
The original RFP for the new OST system was released in December 2004 and the first programs began operating in September 2005. The overall vision behind OST was the creation of a program that "offers safe and developmentally appropriate environments for children and youth when they are not in school." In order to achieve this vision, nine specific goals were developed.
The RFP specified five service options that bidders could respond to; three were program delivery options and two were support options to provide technical support and program evaluations. Option I, which accounted for the vast majority of the individual programs, included programs for elementary, middle, and high school students in school-based or center-based locations. Option II also included all grade levels, but differed from the first option in that providers were required to fund up to 30 percent of their budgets with private sources. Option III, which served children from ages 6 through 21, included programs operated in collaboration with the Department of Parks and Recreation that were offered at park sites across the city. These included three specialized programs: Reach, Academic Support, and Life Skills. Option IV was a separate competition for organizations to provide technical assistance to program providers in Options I through III. Option V was a competition to identify a research organization to conduct evaluations of the OST system. These evaluations were the basis for the changes in the high school portion of the OST system in 2009, as well as the redesign of the elementary and middle school programs incorporated in the new RFP currently being implemented.
In 2009, in response to the program evaluations, research, and focus groups as well as budget reductions, DYCD redesigned the Option I high school programs. The altered design significantly reduced the number of participants, while focusing more intensive services on two target groups: a high school transition program for incoming ninth graders and a transition to adulthood program for low-income 11th and 12th graders. These contracts were scheduled to expire August 31, 2012, but DYCD has announced that they will be renewed until 2015.
Similarly, based on the additional feedback from program evaluation studies, including studies on summer learning loss over the last few years, the 2011 RFP for elementary and middle schools has consolidated the number of goals to five. The new programs will focus on providing youth with skills needed to transition from elementary to middle school. Each provider will be required to hire an educational specialist to implement curricula and develop activity plans. The new programs emphasize youth development, social and emotional learning, quality programming and staffing, stronger school partnerships, and parental/caregiver engagement and will include a greater focus on strengthening literacy and numeracy skills, along with increased parental engagement. Programs are also required to stimulate interest in "STEM": science, technology, engineering, and math.
The new RFP sought bidders to deliver four different services. There were two program competitions, one specifically for elementary school students in kindergarten through fifth grade, and another for middle schoolers from sixth grade through eighth grade, plus two other competitions to provide technical assistance and program research to support providers in the first two service levels. Under the new system, all programs previously in Options II and III will be discontinued. However, groups submitting proposals were able to select from a diverse range of sites, including sites offered by the New York City Housing Authority and the parks department which had previously hosted programs under Options III.
OST and Other After-School Programs. Aside from OST, several other DYCD programs offer various types of after-school services to city youth including Beacons, Cornerstone, Transition to Adulthood, Teen Action, and programs run by The After School Corporation. While many of these programs preceded the implementation of the Out-of-School program, OST is now the largest after-school program administered by DYCD and is the focus of this study.
While OST was never meant to replace the other DYCD programs, it was originally intended to eliminate the need for the after-school child care programs administered by ACS. The ACS after-school programs provided year round services in child care centers and family day care homes that served children 5 years and older. Unlike OST or other DYCD programs, ACS programs also provided transportation services. The ACS after-school programs were expected to be phased out as OST expanded, although this goal has only been partially achieved.
The Expansion and Contraction of the OST System
After beginning operation in September 2005, the OST program expanded rapidly with capacity and participation peaking in 2008. Starting in 2010, however, budget reductions resulting from the city’s fiscal difficulties and program enhancements that have increased the cost per slot have led to a significant reduction in the number of slots provided.
Implementation of a new round of contracts under the most recent RFP was expected to further reduce the size of the OST program in 2013. As part of the 2013 Adopted Budget, however, the City Council added $50.6 million in discretionary funds to preserve nearly 30,000 slots that were not funded under the new contracts, preventing a significant decrease in capacity. These funds will not be used to add capacity to the programs that received contracts under the new RFP; instead they will go to programs that were slated for closure, including some Option II programs, essentially creating a two-tier OST system for one year.
The new RFP programs, which are scheduled to begin in September, will receive significantly higher reimbursement rates to enable them to hire educational specialists to develop enhanced curricula and activity plans. While the Council-funded programs will be encouraged to provide some service enhancements, they will be constrained by reimbursement rates that are considerably below rates for programs established under the new RFP.
Funding Trends. OST is predominately funded with city dollars, making it particularly vulnerable to city budget cuts. In 2012, city funds accounted for 95.1 percent of the OST budget, while state and federal funds accounted for 4.8 percent and 0.1 percent, respectively. During the years of OST expansion, city funding for the program increased from $61 million in 2007 to a pre-2013 peak of $108 million in 2009. With the city’s recent budget difficulties, city funding dropped to $93 million in 2010 and $90 million in 2011. These decreases would have been even greater had it not been for significant one-year funding restorations made by the City Council during the annual budget adoption process. City funding for OST remained at $90 million in 2012, which included $12 million in City Council discretionary funds. Last spring’s Executive Budget proposed a 20 percent decline in city funding, to $72 million in 2013. City Council additions to the 2013 Adopted Budget have instead increased city funding for OST to $122 million, the highest level thus far.
The Out-of-School Time program has also faced additional challenges due to recent reductions in state and federal funds. From 2007 through 2009 OST received about $10 million annually in state funds, primarily Youth Development and Delinquency Prevention grants. Since then, state funding has decreased to $7 million in 2011 and $5 million in 2012. The OST program also received federal funding of $8 million in 2010 and $4 million in 2011, mostly economic stimulus funds which are no longer available.
Changes in city funding have driven changes in total funding for OST. Funding from all sources for 2012 totaled $95 million, down from $101 million in 2011 and $119 million in 2009. With the additional City Council funding in the adopted budget, total funding for 2013 is $126 million, $7 million higher than the previous peak in 2009. Unlike the multiyear appropriations included in the latest RFP, Council funding is for one year only. As a result, the funds—and the slots—added for 2013 will not necessarily be available in 2014 and beyond.
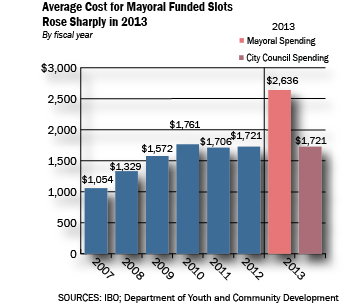
As total funding and spending rose, average costs were also rising, largely driven by program enhancements. By 2010, costs per slot averaged $1,761 per student, up from $1,054 in 2007. (Cost per slot is calculated by taking the total OST budget
—excluding administrative costs—and dividing by the number of slots budgeted. It does not reflect costs incurred by OST providers.) The cost per slot then leveled off over the next two years before rising steeply to average $2,636 in 2013. The combination of funding reductions and rising unit costs has led to a significant reduction in the capacity of the OST system, a trend that had been expected to accelerate when the new RFP was implemented in 2013.Major changes to the OST program have contributed to increases in the cost per slot from 2007 through 2010 and in the current year. In 2008 the department expanded the number of elementary school slots by adding 112 new programs which were required to offer year round services. Making the new programs year-round was an enhancement to the original RFP which had provided for separate school year and summer programs. In subsequent years additional elementary school programs converted to year-round services, further increasing the average cost per slot. In 2009, the department redesigned the high school programs to target two specific categories of students, serving fewer youth but with a more rigorous and costly program. Similarly, the new RFP programs will offer a more structured, higher quality, and more costly service model based on findings from the program evaluations, studies, and input from various stakeholders for both elementary and middle school students.2
The cost of Mayoral-funded OST slots in 2013 will average half again as much as those funded by the City Council. According to DYCD, the cost per slot of the elementary and middle school programs under the new RFP will average $2,737.3 When combined with the ongoing high school slots, the average cost per slot for the Mayoral-funded OST programs will be $2,636. In contrast, the average cost per slot for the City Council discretionary Option I elementary and middle school programs will be $1,902. When combined with the lower cost Option II programs, the average cost per slot for the Council-funded OST programs will remain at the 2012 average rate of $1,721.
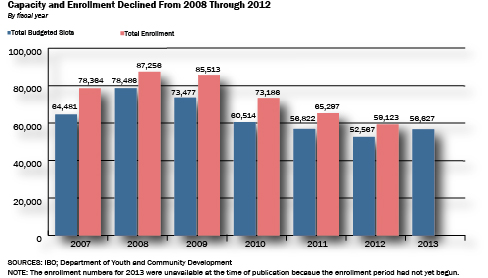
Capacity. In its early years OST expanded rapidly. By 2007, its first full year of operation, citywide capacity reached 64,500 slots, and in 2008 capacity increased to a peak of 78,500. In spite of an increase in the OST budget, in 2009 the number of available slots fell to 73,500 due to an increase in the cost per slot. In 2010 budget reductions and another increase in the cost per slot led capacity to decline to 60,500. Additional budget reductions further reduced the number of available slots to 56,800 in 2011 and 52,600 in 2012.
The considerable decline in OST capacity since 2008 has primarily resulted from budget reductions, but increases in the cost of each slot have also played a role. From 2009 through 2012, the OST budget was reduced by $24 million (20 percent), while the number of slots fell by 20,900 (28 percent). If the cost per slot had remained at the 2009 level, the decline in capacity due to budget reductions would have been about 15,000 slots. Alternatively, if the budget had remained at the 2009 level, the rise in the cost per slot would have resulted in a decrease in capacity of about 6,000.
The initial expansion and more recent contraction in capacity did not occur evenly among the various service options and grade levels. Option I programs serving elementary school children have fared best over this time period, with capacity expanding rapidly through 2008 and remaining largely untouched by the budget reductions of 2010 through 2012. In 2008, the number of Option I slots serving students in elementary schools increased by 73 percent to reach 38,300. The expansion was achieved largely by adding 112 elementary programs and requiring these new programs to operate year round. By 2012, the number of available slots in this category remained largely unchanged at 36,000, while other OST categories had been significantly reduced in size. As a result, by 2012 nearly 70 percent of all OST slots were in Option I elementary school programs.
Unlike the elementary school programs, the other Option I categories peaked in 2007 and subsequently lost capacity. Option I middle school capacity peaked at 14,700 slots, and then fell steadily to 9,300 slots in 2012. The decline in Option I high school programs was even more pronounced. After decreasing from 14,100 slots in 2007 to 11,400 in 2009, the capacity of the high school programs plummeted to 1,600 in 2010 and 1,800 in 2011 and 2012. The large drop in capacity was a result of the redesign of the high school programs in March 2009. DYCD determined that in order to better address such challenges as attendance in serving high school youth, it would need to devote more resources per student to a smaller, more narrowly targeted population.
The capacity of the Option II and Option III programs has also decreased since 2007. The total number of slots in Option II programs, which require a 30 percent private funds match, declined steadily from 11,900 in 2007 to 4,200 in 2012. When called upon by the Mayor’s budget office to propose cuts, DYCD focused on Option II, because the agency determined those programs did not match the overall quality of Option I programs. In 2009, the agency proposed eliminating all Option II programs, but the availability of federal stimulus funds allowed them to continue. Since then the City Council has restored funding for Option II programs one year at a time, although at gradually reduced levels. The capacity of Option III, which includes a small number of programs located in parks, decreased from 1,600 slots in 2007 to 1,200 in 2012.
Capacity in 2013. Based on proposed budget cuts and increases in the cost of each slot under the new RFP, OST capacity was expected to decline further in 2013, as it had each of the past four years. But with the City Council’s funding for 29,600 slots, the total number of slots budgeted will rise to 56,600, an increase of 4,000 slots, or nearly 8 percent.
Prior to the adoption of the budget in June, the downward trend in OST capacity had been expected to accelerate in 2013, with the total number of slots shrinking by nearly 50 percent from 52,600 to 26,900. Implementation of the new RFP was expected to sharply cut the number of Option I elementary school slots from 36,000 to 15,500. Moreover, all Option II and III contracts would be discontinued, a reduction of another 5,400 slots. In contrast, the number of Option I middle school slots would have risen modestly from 9,300 to 9,700 and—with the renewal of the 2009 high school contracts—the number of Option I high school slots would have remained at about 1,800.
These planned reductions in capacity were in part the result of cuts proposed in the Mayor’s November 2011 Financial Plan, as well as prior reductions, with total OST funding budgeted to decline 20 percent, from $95 million in 2012 to $76 million in 2013. However, the planned reductions in capacity were also attributable to service enhancements for elementary and middle school programs under the new RFP, which were expected to increase the average cost per slot by half, from $1,721 to $2,636.
As part of the 2013 Adopted Budget, the City Council added $50.6 million in discretionary funds to preserve about 29,600 slots previously scheduled for elimination under the new RFP, including 21,900 Option I elementary slots, 3,600 Option I middle school slots, and 4,200 Option II slots. The City Council discretionary programs will not operate under the new RFP; instead, the number of OST slots funded by the Council will be based on the average cost per slot in 2012. When combined with the Mayoral-funded programs, OST capacity in 2013 will total 56,600, up from 52,600 in 2012.
Participation. Trends in OST enrollment mirror trends in capacity (total slots budgeted), rising through 2008 and then declining through 2012. Because Option I elementary school programs were largely spared the budget cuts of the past few years, enrollment declines in these OST programs have been relatively modest. But enrollment in Option I middle and high school programs has fallen more sharply, reflecting the deeper reductions in funding for these programs serving older students. With the total number of budgeted slots once again increasing in 2013, enrollment is also expected to rise.
The most basic measure of participation in OST is enrollment, which is defined as the number of participants actually attending the program over the course of a year. Enrollment does not take into account frequency of attendance; a child who enrolls in OST and attends only one time is counted the same as a child who attends 100 times in a year. For this reason, it is possible for the number of youth enrolled in a program to be greater than the number of available slots. In fact, programs are permitted, by contract, to over-enroll by 20 percent because it is expected that some children will attend only sporadically.
Because of the limitations of the enrollment measure in determining the level of participation in OST programs, it is useful to also look at the total number of service units utilized by participating youth each year. For Option I elementary school programs, data is available on the number of service days utilized. For most of the other program categories service utilization is measured in hours, since there are no contractual requirements for middle school and high school programs to provide services every day. For the smallest of the categories, Option III, no service utilization data is available.
Trends in participation levels in OST programs over the years have mirrored changes in capacity. The total number of youth enrolled in OST increased from 78,400 in 2007 to a peak of 87,300 in 2008, before steadily declining to 59,100 in 2012, a decrease of about one-third from the peak enrollment. More recently, increases in the number of OST slots budgeted for 2013 will translate into increases in enrollment for this year.
Participation in Option I elementary programs peaked in 2009 and declined gradually through 2012. The number of children enrolled in Option I elementary school programs increased significantly from 28,300 in 2007 to 45,400 in 2009, while the total number of service days increased from 3.2 million to 4.9 million. Because the Option I elementary programs were largely spared the budget cuts of the last few years, enrollment declines in these programs have been relatively modest, totaling 9 percent from 2009 through 2012. Enrollment is expected to increase modestly in 2013.
In contrast, participation in Option I middle and high school programs has declined sharply in response to reductions in capacity. The number of youths enrolled in middle school programs decreased by 38 percent, from 19,100 in 2007 to 11,900 in 2011, while total service hours declined from 3.9 million to 2.8 million. Enrollment decreased again to 11,200 in 2012. The enrollment decline is likely to reverse in 2013 as capacity increases. Not surprisingly, the huge reduction in capacity that resulted from the redesign of the Option I high school programs had a major impact on enrollment, which dropped from 12,300 in 2009 to 1,800 in 2011 and 1,900 in 2012. Enrollment is likely to hold steady in 2013. The impact of capacity reductions is also reflected in the enrollment numbers for Option II programs, which fell from 14,000 in 2007 to 3,600 in 2012, and in Option III enrollment, which declined from 1,700 to 1,000 over the same period.
OST and ACS After-School Child Care
Part of the original motivation for creating OST was to save the city money by moving children in ACS after-school child care into the less costly OST program—a process that has only been partially successful. There was still an average of 7,800 school age children in ACS child care centers or family day care homes in 2012, down from 17,900 in 2003. When the OST system was created, ACS gave vouchers to parents of children in after-school child care who were not able to find a comparable OST program for their children near their homes. The vouchers allowed the children to remain in ACS programs. Since then ACS has continued to provide vouchers to families whose children age out of ACS child care and are unable to find a comparable OST program near them. As of January 2012, there were 8,100 low-income school-age children in ACS child care centers or family care; 90 percent of them were using vouchers. The school-age voucher program at ACS has been extended to 2013.
In order to facilitate the movement of children into OST from ACS after-school care, OST providers are required to give all eligible ACS children priority for admission into their programs. DYCD also has an ACS-only enrollment period at the beginning of each program year. Currently, there are about 8,200 former ACS children in the OST system. In order to continue to accommodate them, the new RFP will set aside about 8,000 slots for former ACS children out of the 26,900 slots available in the new program, which will reduce the number of spaces available for children not coming from ACS.
The goal of saving money by moving children from ACS after-school child care into OST has also been stymied by the rising cost per slot in the OST program. With the newly added services, the average cost per slot for Mayoral-funded OST programs is expected to be $2,636, nearly as much as the $2,748 average cost of the ACS after-school vouchers funded in the 2013 Adopted Budget.
Conclusion
The City Council’s one-year funding of nearly 30,000 slots as part of the 2013 Adopted Budget interrupted a downward trend in the capacity of the OST system. Originally conceived as a means of expanding after-school services at a lower cost per child than ACS child care, OST expanded rapidly with overall capacity peaking at 78,500 in 2008. Since then, however, budget reductions resulting from the city’s and state’s fiscal difficulties, along with program service enhancements that have increased the cost per slot, led to a significant reduction in service. The number of available slots fell steadily, reaching 52,600 in 2012—a loss of one-third of peak program capacity.
Prior to the recently adopted budget, the downward trend in OST capacity was expected to accelerate in 2013, with the overall number of slots shrinking by nearly 50 percent to 26,900. The expected reduction in capacity would have resulted from both another funding reduction and the implementation of a new round of contracts under the most recent RFP, which calls for more service-intensive, but costlier after-school programs in elementary and middle schools. In response to concerns about the loss of after-school services, the City Council added $50.6 million to fund nearly 30,000 slots that had been scheduled to close along with the program changes.
The adopted budget agreement between the Mayor and City Council can be seen as a compromise between the goal of achieving a more service intensive OST system at a higher cost per slot, and the need to preserve system capacity. Mayoral funding will be used to create upgraded programs under the new RFP, while the City Council discretionary funds will preserve enough of the current, less costly programs to allow for modest growth in the total number of available slots. Since the Council funding is for one year only, however, the issue of how to achieve the proper balance between program quality and service capacity is likely to be revisited later this year.
This report prepared by Nashla Rivas Salas
Endnotes
1All years referenced are fiscal years unless otherwise noted.2In addition, under the new RFP all programs will be required to offer year-round services. As of 2012, some programs still did not include a summer component.
3The calculation of the cost per slot for 2013 for programs under the new RFP is complicated by the fact that the new programs begin in September 2012, after fiscal year 2013 is already underway. However, the cost per slot for 2014 is expected to remain at about $2,737.
PDF version available here
.