
NEW YORK CITY TRANSIT'S FISCAL CONDITION
August 18, 1999

NEW YORK CITY TRANSIT'S FISCAL CONDITION
August 18, 1999
The fiscal condition of New York City Transit, the arm of the Metropolitan Transportation Authority that runs the city's subway and bus systems, has grown much stronger in recent years. In fact, NYC Transit has realized budget surpluses in each year since 1996. Nevertheless, over the next few years a number of different pressures are expected to erode and even reverse these budgetary surpluses.
The Independent Budget Office has prepared this report at the request of Councilmember Gifford Miller to inform elected officials and the public about the agency's fiscal condition at a time of increasing ridership and commensurate demands on the transit system. Established in 1996 pursuant to the New York City Charter, IBO provides nonpartisan analysis to elected officials and the public on fiscal and budgetary issues affecting New Yorkers.
Summary of Findings
IBO’s principal findings and conclusions are as follows:
This report is organized into four sections. The first looks at recent trends in ridership, revenues, and operating costs for New York City Transit. The next section reviews the system’s capital budget and how the capital program is financed. The third section discusses NYC Transit’s budget projections and presents the results of three scenarios we have modeled. We conclude with a brief discussion of potential expansion of the subway system.
Ridership, Revenue, and
Operating Cost Trends
Assessing New York City Transit’s financial condition requires consideration of recent trends in several critical areas: ridership, revenue, and operating costs. The combined performance of these variables has been a crucial factor in NYC Transit’s improved fiscal health over the last decade.
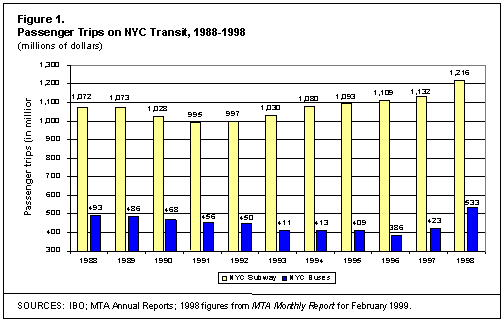
Ridership. As shown in Figure 1, subway ridership has grown each year since 1993 as the New York City region emerged from the 1990-1992 recession. Ridership continued to grow even after a fare increase to $1.50 in November 1995. Ridership increased sharply in 1998, the first full year of fare discounts. The number of subway passengers reached 1.2 billion that year, the highest level since 1971. The trend in NYC Transit bus ridership is different. The number of trips declined continuously from 1988 to 1993 and then remained fairly stable until 1995. Ridership fell sharply following the 1995 fare increase, but then rebounded strongly in 1997 after the Metropolitan Transit Authority (MTA) instituted free transfers between buses and subways. The number of bus trips in 1998¾ the first full year of free transfers¾ was 533 million, or 26 percent higher than the previous year.
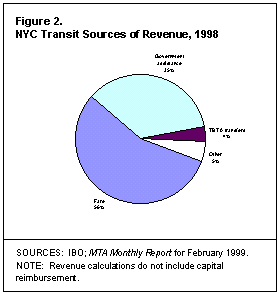
Revenues. NYC Transit’s revenues are derived from fares, governmental support in the form of dedicated tax revenues and direct subsidies, and transfers from the Triborough Bridge and Tunnel Authority (TBTA). Figure 2 shows that in 1998 about 56 percent of revenues came from fares, 35 percent from governmental assistance, and 4 percent from TBTA transfers. Other revenue sources, such as advertising income, accounted for about 5 percent of the total.
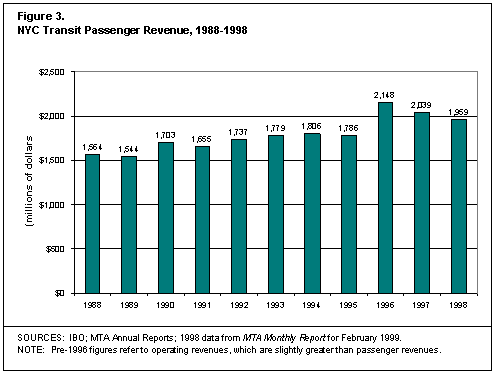
Passenger revenue is affected by both the number of riders and the level of fares. A 20 percent fare increase in November 1995 was followed by a similar rise in passenger revenue in 1996 (see Figure 3). The total number of passenger trips on NYC Transit remained roughly constant as the negative impact of the fare increase was offset by the city’s economic rebound. The introduction of discount fares in 1997 caused revenues to decline, but by less than forecast due to unexpectedly large increases in ridership. Passenger revenue in 1998 was $1.96 billion, 8.8 percent below the actual 1996 level, but 9.6 percent higher than projected at the start of the year.
 Because more trips are being made and less fare revenue collected, average revenue per passenger trip has fallen. Riders paid an average of $1.12 per bus and subway trip in 1998, down from a peak of $1.44 in 1996. (Trips involving transfer between buses or between buses and subways are counted as multiple trips.) In inflation-adjusted terms, average revenue per passenger trip in 1998 was at its lowest level in more than a decade.
Even as transit riders in New York City are paying less on average for their trips, they are also paying an increasing share of their systems’ operating expenses. According to data from the Federal Transit Administration (FTA), the share of NYC Transit’s operating expenses covered by fares increased from 51 percent in 1994 to 66 percent in 1997, and was the highest of any large US transit system. By way of comparison, in 1997 fares covered 60 percent of operating expenses on Metro-North, 54 percent on the Long Island Railroad, 50 percent in Washington, DC, 46 percent in Chicago, 30 percent in Los Angeles, and 29 percent in Boston.1
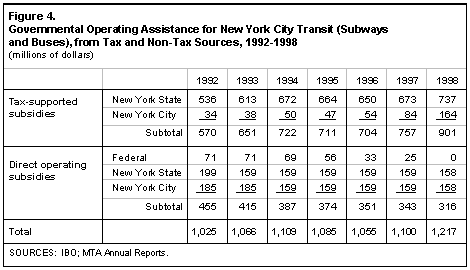
Governmental assistance. NYC Transit receives funding for operations from a variety of non-fare sources. With the exception of TBTA surpluses (discussed below) and some minor revenue streams such as advertising income, these funds consist of direct operating subsidies from state and local governments and indirect, tax-supported subsidies generated from a mix of state and city taxes. (Until 1998 NYC Transit also received operating assistance from the federal government.) The tax-supported subsidies include dedicated portions of the city real property transfer tax, the city mortgage recording tax, the state mortgage recording tax, and the state petroleum business tax. There are also surcharges on the state’s business franchise taxes assessed on activity occurring within the 12 counties served by the MTA. Finally, there is an add-on to the sales tax within the MTA region. Figure 4 summarizes the levels of governmental funding over the 1992-1998 period.
Tax-supported operating subsidies have increased dramatically in recent years, from $570 million in 1992 to $901 million in 1998. This increase is due to unusually high tax collections generated by the strong regional economy and changes in the allocation formula for the petroleum business tax. Tax-supported subsidies are a volatile and uncertain revenue source. Revenues from the mortgage recording tax are especially prone to fluctuation, even under relatively stable economic conditions. In addition, the state diverted part of the dedicated tax funds for general budget relief in the 1995-1996 fiscal year, and in recent years has paid part of its direct subsidy to NYC Transit out of dedicated tax funds rather than from the state’s general fund.
Direct operating subsidies have followed a different trend from tax supported subsidies. As shown in Figure 4, NYC Transit received no federal operating aid in 1998, compared with $71 million in 1992. State and local operating subsidies declined slightly from 1992 to 1994, and have since each remained roughly $159 million per year. State and local numbers are identical in recent years because the State Transportation Law (section 18-b) requires localities to match the state’s contribution. As noted above, the state’s direct subsidy has in recent years included money from dedicated taxes.
The net result of the increase in tax-supported subsidies and the decline in direct subsidies is that total governmental assistance to NYC Transit increased approximately 20 percent, from $1.0 billion to $1.2 billion between 1992 and 1998.
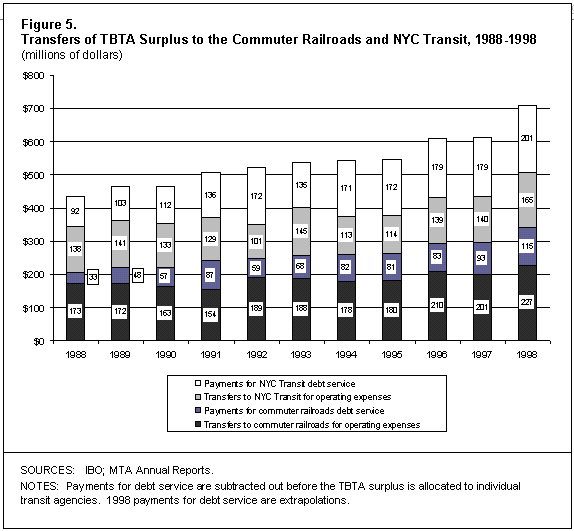
TBTA Surplus. The operating surplus of the Triborough Bridge and Tunnel Authority (TBTA¾ also known as MTA Bridges and Tunnels) is an important additional source of funding for both NYC Transit and the commuter railroads. The surplus is generated from tolls collected on the authority’s six bridges and two tunnels. Those tolls greatly exceed the sum of TBTA operating costs and the debt service on bonds used to finance bridge and tunnel projects. The amount transferred from the TBTA to the MTA has grown substantially in recent years, and was 62 percent higher in 1998 than in 1988. Figure 5 shows how this surplus was distributed between the two transit systems during the 1988-1998 period.
The first $24 million of the TBTA surplus is allocated to NYC Transit, with the rest split evenly between NYC Transit and the commuter railroads.2 Not all of the TBTA surplus is available for operating expenses, because the debt service for bonds issued by the TBTA on behalf of the transit agencies is first subtracted out. Most of this debt service corresponds to NYC Transit projects rather than commuter rail projects. As a result, although NYC Transit receives less than half of the money available for operating expenses it receives over half of the total surplus. In 1997, for example, NYC Transit received $318 million from the TBTA surplus and the commuter railroads $294 million. Of the portion of the surplus available for operating expenses, NYC Transit received $140 million¾ considerably less than the $201 million received by the commuter railroads. In contrast, the TBTA made $179 million in debt service payments on behalf of NYC Transit, compared with $93 million on behalf of the commuter railroads.
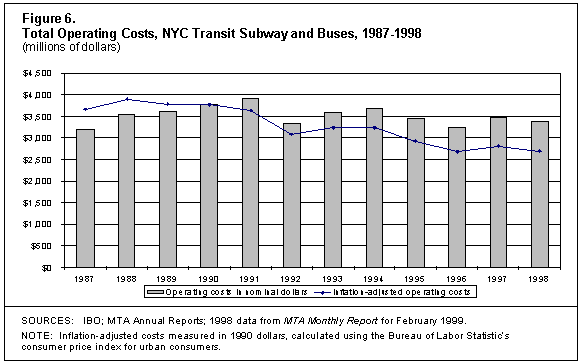
Operating expenses. As shown in Figure 6, NYC Transit’s operating expenses have remained fairly stable in recent years. Operating expenses in 1998 were $3.4 billion, about 13 percent less than their peak in 1991. In inflation-adjusted terms (1990 dollars) the decline in operating expenses is substantial¾ from a high of $3.9 billion in 1988 to $3.6 billion in 1991 and $2.7 billion in 1998. These trends reflect the effectiveness of New York City Transit’s program of expense control, a major component of which has been workforce reduction through attrition.
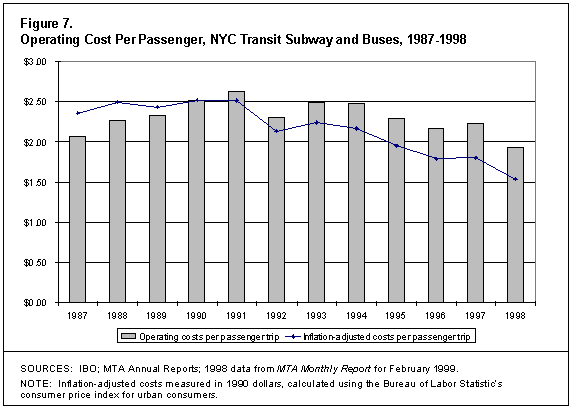
Because passenger loads have risen while total costs have been relatively constant, there has been a substantial reduction in cost per passenger. (See Figure 7.) Per-passenger costs fell from a peak of $2.63 in 1991 to $1.93 in 1998, a decline of 27 percent. Measured in inflation-adjusted 1990 dollars the decline was 39 percent, from $2.51 to $1.54. While these results are encouraging, they should be balanced against the discomfort, delays, and lost productivity experienced by passengers as buses and trains have become increasingly crowded.
The overall picture: NYC Transit’s operating deficits and surpluses. NYC Transit ran deficits throughout the early 1990s, and by 1995 had an accumulated deficit of $1.4 billion. Starting in 1996¾ the year of the last fare increase¾ the agency began to have large annual surpluses: $433 million in 1996, $314 million in 1997, and $454 million in 1998. As a result, the accumulated deficit was reduced to $150 million by the end of 1998.
A final measure is needed to fully assess New York City Transit’s current and future fiscal condition—the share of the capital budget funded from the current operating budget. The following section reviews the agency’s capital financing strategy and the resulting debt service burden.
The Capital Budget
Funding MTA’s capital program. After years of neglect, the Metropolitan Transportation Authority began a major capital rebuilding program in the 1980s. This investment has been crucial in restoring the region’s transit systems, although much work remains to be done. Under consecutive five-year plans, nearly $16 billion¾ about $1.6 billion annually¾ was allocated to the MTA capital program from 1982 through 1991. Funding levels were increased to $1.8 billion per year ($9 billion total) under a new plan for the 1992-1996 period. In 1996, with much of the planned work not yet completed, the MTA requested and was granted permission to extend the existing capital program to 1999. The 1995-1999 capital program (the last two years of the 1992-1996 plan, plus three additional years) called for spending over $2.4 billion per year¾ $12.2 billion total. (See Figure 8.)
The MTA capital programs for the 1982-1999 period total more than $33 billion, after accounting for the overlap between the 1992-1996 and 1995-1999 plans. More than $29 billion in funds had been committed through the end of 1998, while expenditures totaled almost $24 billion. For NYC Transit alone, commitments were around $22 billion and expenditures were $17 billion.
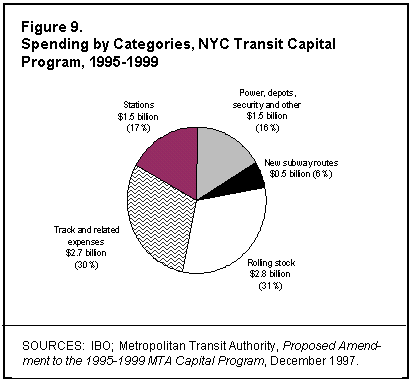
Under the MTA’s current 1995-1999 plan, about $9 billion is allocated to New York City Transit and $3 billion is targeted for commuter rail. As shown in Figure 9, over three-quarters of New York City Transit’s share of spending under the current plan is for maintenance and renovation of the rolling stock (31 percent), stations (17 percent), and track and related expenses (30 percent). Subway expansion accounts for roughly 6 percent of the budget. This money has been used for the 63rd Street Connector and preliminary studies for possible future projects.
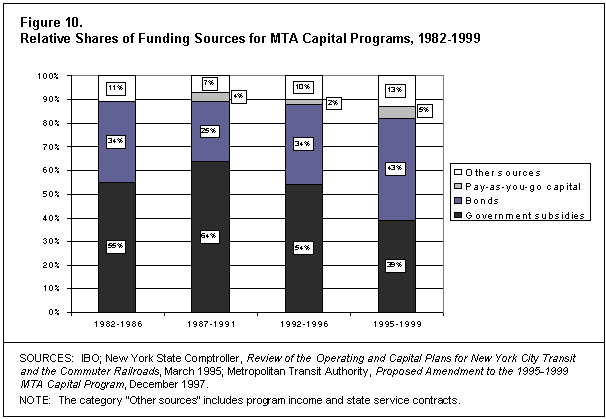
The MTA’s capital programs have been financed using a combination of governmental subsidies, bonds backed by fare and toll revenues, and transfers from the operating budget. The mix of sources has changed over time, with a gradual shift in the financing burden from direct governmental subsidies to bonds and transfers from the operating budget.
Direct governmental subsidies reached a peak of $5.2 billion in the 1987-1991 plan and then fell in each of the two subsequent plans. These subsidies accounted for 55 percent of the capital financing in the 1982-1986 plan and 64 percent in the 1987-1991 plan, but only 39 percent in the 1995-1999 plan. (See Figure 10.) Direct state aid for the capital programs has practically disappeared, and has been replaced by a similar amount of proceeds from bonds issued by the MTA and backed by state taxes dedicated to transit. The share of MTA bond financing backed by dedicated taxes, transit fares, bridge and tunnel tolls,
and governmental operating subsidies has risen from 25 percent of the 1987-1991 plan to 43 percent of the current plan. The use of bond financing instead of direct aid commits future streams of dedicated tax revenue to paying debt service. This in turn means that the amount of future revenue from these taxes that is available for new capital investment is reduced.
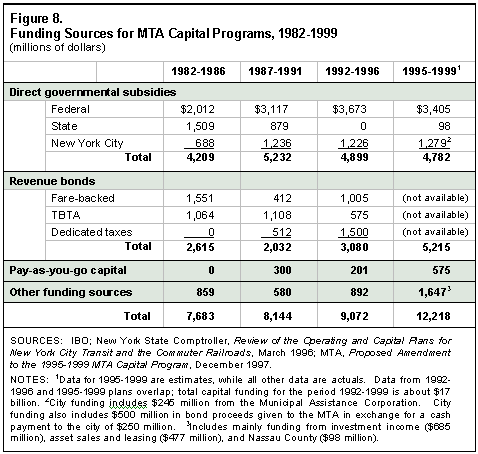
Transfers from the operating budget (pay-as-you-go) appeared for the first time in the 1987-1991 capital program and have grown to 5 percent of total funding in the current program. By making these transfers, NYC Transit is using operating revenues to directly finance capital projects rather than securitizing a stream of future revenues to pay for projects today. This approach has the advantage that it does not burden the transit system and its riders with future debt service needed to pay off bonds. The disadvantage of these transfers is that this money is no longer available for operating expenses. In addition, since the entire project must be paid for directly out of current revenues, in the short run the overall capital program must be less ambitious.
Debt and debt service. As of late 1998, the MTA’s outstanding long-term debt totaled about $12 billion. According to the Authority’s projections, payments of interest and principal (debt service) to bondholders for this debt will average $900 million each year through 2002—equal to around 17 percent of total operating expenses annually. The overall level of MTA debt service costs is generally not a major concern. The authority’s bonds are secured by and payable from operating revenues and subsidies, with about 40 percent of the total debt service expenditure repaying bonds issued by the TBTA, an entity that runs large annual operating surpluses.
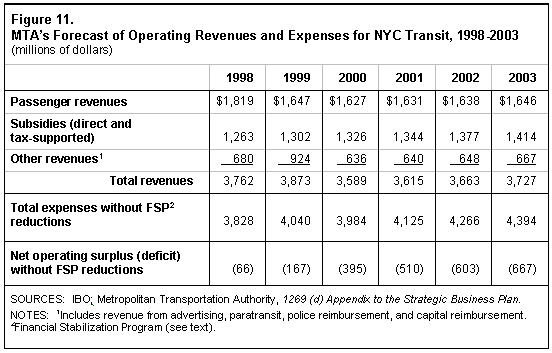
Although debt service expenditures for the MTA as a whole appear to be manageable, the rapid increase in debt service paid directly by NYC Transit may be a cause for concern. NYC Transit bonds, like MTA bonds, are repaid out of revenue streams¾ fares, tax-supported subsidies, and direct governmental subsidies. The MTA estimates that the amount of debt service paid by NYC Transit, not including TBTA payments, will double between 1997 and 2003, growing from $163 million to $329 million. With total operating expenses expected to grow much more slowly (see Figure 11), NYC Transit’s debt service as a share of expenses is expected to increase from about 5 percent to around 8 percent over the same period. Such an increase will have significant consequences for the agency’s operating budget.
In the near term, despite the rebuilding efforts of the last two decades, large capital investments are still needed to bring the system up to good repair. There is also growing interest in expanding the system. Without substantial increases in direct governmental assistance, operating revenues will probably continue to bear an increasing share of the cost of financing new capital investments in the transit system. Increasing the share of operating revenues dedicated to capital investment (either through debt financing or pay-as-you-go financing) would likely create additional fiscal pressures on NYC Transit. Alleviating these pressures would require extracting savings from operating expenses through increasing productivity and/or reducing service, or by increasing other sources of revenue such as fares.
NYC Transit’s Fiscal Condition
Background. The current operating surplus of NYC Transit is the result of a less than expected decline in fare revenues, a large increase in dedicated tax revenues, and an effective program of cost containment. However, fare revenues could decline as more passengers shift to using unlimited ride Metrocards, or in response to slower economic growth. Moreover, funding from dedicated taxes is also dependent on general economic conditions. Proceeds from the mortgage recording tax are especially volatile; even under conditions of economic stability, revenues have varied by 25 percent or more from one year to the next. Finally, although NYC Transit is continuing its efforts to cut operating costs, the increasing demand for service that has accompanied the surge in ridership may make further expense reductions difficult to achieve.
If NYC Transit experiences a decline in revenues and/or an increase in costs in the near future, its operating surpluses could quickly become deficits¾ which would likely be covered by some combination of reductions in service, increases in productivity, additional governmental assistance, or increases in fares.
This section begins with an overview of MTA’s most recent forecast of NYC Transit’s financial condition over the next few years. We then present IBO’s forecasts of NYC Transit’s net operating balances under three different scenarios. The first scenario is an update of the MTA’s most recent forecast, using actual financial results from 1998. The second and third scenarios are variations on the first. The second scenario makes the optimistic assumption that NYC Transit continues to contain expenses. The third scenario is pessimistic and assumes a sharp reduction in governmental assistance.
MTA’s projections. In its most recent forecast, published in 1998, the MTA projected that net operating balances for New York City Transit will be negative each year from 1999 through 2003. The forecast deficits are substantial in the first two years ($167 million in 1999 and $196 million in 2000), and close to zero during the remaining years. (See
Figure 11.) The forecast is based on the assumption that during this period fare revenues will remain roughly constant, subsidies will increase by about 8 percent, and expenses will decline by about 8 percent.
These cost projections incorporate unspecified expense reduction measures, referred to as a Financial Stabilization Program (FSP), beginning in 2000. (In NYC budget parlance these measures are referred to as PEGs or Programs to Eliminate the Gap.) Because the MTA does not specify the expense reductions it would make, any savings are very uncertain; IBO assumes that they will not occur. Excluding the Financial Stabilization Program, expenses are projected to decline 1.4 percent in 2000, and increase by 3 percent to 3.5 percent in each of the following three years. The cumulative increase in expenses between 1999 and 2003 is 9 percent. As a result the out-year deficits are quite large, reaching $667 million (13 percent of total expenses) in 2003.
IBO scenarios. We have developed three scenarios to project revenues and expenses for NYC Transit under varying conditions over the 2000-2003 period. IBO’s Scenario I updates the MTA’s projections. Two alternative scenarios build on the updated MTA forecast. A more optimistic scenario (Scenario II) is based on the assumption that expenses increase at a slower rate than in the MTA’s projections. A more pessimistic scenario (Scenario III) assumes that governmental subsidies decline.
Scenario I: An update of MTA’s forecast. Year-end revenue, subsidy, and cost data for 1998—unavailable when the MTA made its projections last year¾ have made it possible to more accurately predict NYC Transit’s fiscal condition for 1999 and beyond. Our first scenario is essentially an update of the MTA’s projections (excluding unspecified expense reductions) based on actual data from 1998 but adopting the longer-term trends forecast by the MTA.
In 1998, the MTA projected that NYC Transit passenger revenue would be $1.82 billion in 1998 and $1.65 billion in 1999. In fact, passenger revenue was $1.96 billion in 1998, approximately $80 million below the level of the previous year, but $140 million higher than projected. The $80 million reduction in revenue from 1998 was the net result of fare discounts being implemented against a background of increased ridership. The major new fare initiative during 1998 was the unlimited ride Metrocard, introduced on
July 4th. This discount fare will be in place during all of 1999. IBO calculates that increased adoption of the unlimited ride Metrocard, combined with slower overall economic growth, will reduce passenger revenues even further¾ about $90 million in 1999.
NYC Transit has recently introduced another discount fare. The "Fun Pass" is a Metrocard that offers one day of unlimited bus and subway rides for $4. The Fun Pass is marketed primarily to visitors; it is not yet available in most subway stations. While the Fun Pass will reduce the amount some visitors spend on buses and subways, it will also attract riders who would otherwise use taxis. We assume in all of our scenarios that the Fun Pass will cause an additional reduction of $10 million in passenger revenue.
Taking all the new fare discounts into account, IBO projects that passenger revenue will total $1.86 billion in 1999, $100 million lower than in 1998, but $210 million above the MTA’s projections.
The MTA’s forecast of 1999 direct and tax-supported governmental subsidies may also be too conservative. Their subsidy projection (including TBTA transfers) was $1.26 billion for 1998 and $1.30 billion for 1999. However, the 1998 actual level (again including TBTA transfers) was $1.44 billion, suggesting the need for an upward adjustment in the projections for the current year. IBO assumes that governmental assistance will remain at $1.44 billion in 1999.
Finally, in 1998 the MTA projected that NYC Transit’s expenses would be $3.83 billion in 1998 and $4.04 billion in 1999. Actual expenses in 1998 were $3.90 billion, slightly higher than projected. These results for 1998 together with pressure to increase service as ridership increases, lead IBO to project that expenses will total $4.09 billion in 1999, somewhat more than originally forecast by the MTA.
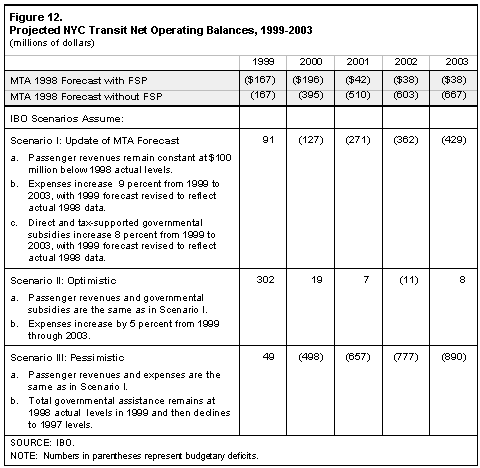
Scenario I assumes the same long-term trends in revenue and expenses as the MTA projections. Passenger revenues remain constant at $1.86 billion (the 1998 actual revenue minus $100 million to account for the impact of discount fares) for the 1999-2003 period. (See Figure 12.) Subsidies increase by a total of about 8 percent, from $1.44 billion in 1999 to $1.56 billion in 2003. Finally, expenses increase from $4.09 billion in 1999 to $4.52 billion in 2003.
Under this scenario, IBO expects NYC Transit will close 1999 with a modest surplus of $91 million (around 2 percent of total expenses) and will end 2000 with a small deficit of $127 million (3 percent of expenses). Deficits increase significantly in the out-years of the forecast, reaching $429 million (9 percent of expenses) in 2003.
Scenario II: Containing expenses. This scenario examines the effect that continued success in cost containment would have on NYC Transit’s finances. We assume that NYC Transit reduces its headcount by 4 percent from 1999 through 2003. (In contrast, NYC Transit reduced its headcount by 9 percent from 1994 through 1998.) Labor costs per worker increase at a rate equal to IBO’s projected rate of inflation, with the result that total labor costs increase 7 percent over the entire period and total expenses increase 5 percent. In contrast, the MTA’s projections without the expense reductions of the Financial Stabilization Program have expenses increasing 9 percent between 1999 and 2003. Scenario II uses the same assumptions regarding fare revenues and subsidies as Scenario I. Under this scenario, IBO expects NYC Transit to run a surplus of $302 million (8 percent of expenses) in 1999; thereafter the agency would roughly break even through 2003.
Scenario III: Reduced governmental assistance. The purpose of this scenario is to gauge the impact of reduced governmental subsidies on NYC Transit’s financial condition. Like the first and second scenarios, this scenario assumes that passenger revenues remain constant at $1.86 billion. Expenses are assumed to increase at the rate projected by the MTA, as in Scenario I. However, while the first and second scenarios assume that subsidies increase at the rate projected by MTA between 1998 and 2003, this scenario assumes that total governmental assistance to NYC Transit remains at $1.4 billion (the 1998 actual level) in 1999, and then declines to $1.1 billion (the 1997 actual level) and remains at this level through 2003.
This reduction in subsidies could come from a cut in direct operating subsidies, but most likely it would come from a fall in revenues from dedicated taxes¾ especially the mortgage recording tax. In 1997, collections from the mortgage tax were on the upswing, but had not yet experienced the surge that began the following year. Thus, fixing governmental assistance at its 1997 value is equivalent to assuming a return to more normal economic conditions.
Scenario III results in a small surplus of $49 million in 1999 (1.4 percent of projected total expenses), then very large deficits each year thereafter. In 2003, the deficit reaches $890 million¾ around 20 percent of projected expenses.
Bottom line. With the actual 1998 revenue and expense figures now available, it is clear that the outlook for New York City Transit’s net operating balance in 1999 is better than the agency projected a year ago. Instead of facing a deficit, the results under our scenarios show a 1999 surplus. For 2000-2003 the results vary widely, depending on the scenario used. However, in no case do we expect large surpluses; under IBO’s most optimistic scenario (Scenario II) NYC Transit essentially breaks even. The agency may face large deficits by 2003, in which case it will have to consider one or more of the following initiatives: further cost savings that might include service reductions or increases in productivity; additional governmental operating subsidies; and fare increases.
Financing Expansion of
the Subway System
There are currently several proposals for expanding the subway system. Mayor Giuliani has proposed extending the 7 subway line to the west side of Manhattan, and has also advocated a rail link with LaGuardia Airport, although only the rail link was included in the city’s adopted budget for fiscal year 2000. The MTA’s Manhattan East Side Alternatives (MESA) study is examining the construction of a Second Avenue subway between 125th Street and 63rd Street. The Regional Plan Association’s Metrolink proposal combines an extended Second Avenue subway with other rail transit improvements. Finally, the City Council has approved the Port Authority’s proposal for a Kennedy Airport rail link, one branch of which will connect with the A subway line at Howard Beach.
There is intense speculation as to whether the MTA will include major new construction projects in its upcoming capital plan, due to be released in late 1999. The Mayor has proposed spending $945 million of the city’s capital contribution to NYC Transit over the next decade for the rail link with LaGuardia Airport. However, this proposal does not represent additional money for public transportation, but rather a diversion of previously announced city funding which had been earmarked for the rebuilding of existing infrastructure.3 The final decision whether to use them for the LaGuardia rail link or any other new construction projects will be made by the MTA. Using these funds for system expansion would provide future benefits to riders, but would also slow progress toward NYC Transit’s goal of achieving a state of good repair throughout the system.
Growing public support for subway expansion has been fueled in part by the perception that increased ridership is permitting NYC Transit to accumulate large surpluses that could be used for capital investment. However, as this report has shown, passenger revenues have declined since fare discounts were introduced and the transit agency’s surplus is primarily due to high dedicated tax revenues—revenues that will decrease when economic growth slows. Moreover, increased subway and bus ridership has led to public pressure on NYC Transit to provide more service, potentially driving up costs and reducing the surplus over time.
It is therefore unrealistic to assume that transfers from New York City Transit’s operating budget will be sufficient to fund new subway construction; major expansions of the subway system will require new sources of funding. Conscious of this fact, civic and transit advocacy groups are discussing a wide array of possible funding sources, such as congestion pricing on roads, time of day (peak-load) pricing on public transportation, tolls on the East River bridges, a special property tax on areas that benefit directly from new subway routes, a reinstatement of the commuter tax, and/or fare increases. Increased federal funding also remains a possibility, despite efforts by some legislators to cap the amount of money received by New York and California. President Clinton has proposed a federal budget for fiscal year 2000 that increases public transit funding by 13 percent over the 1999 level, from $5.4 billion to $6.1 billion. The case of the Bay Area Rapid Transit (BART) rail extension in San Francisco is illustrative of how a well-conceived transit expansion project with local political and financial support can win significant federal funding. Almost two-thirds of the project’s $1.2 billion cost will be paid for with federal funds.
Conclusion
As pressures mount on NYC Transit to provide more service and invest in new infrastructure, it will be important to keep in mind the fiscal realities outlined in this paper. The agency’s financial condition is now markedly better than a few years ago. Nevertheless, even under relatively optimistic assumptions the large operating surpluses of recent years are unlikely to continue. Substantial increases in service or new construction projects are likely to require NYC Transit to seek out new sources of revenue and/or implement a new expense reduction program.
| 1 | The MTA calculates a farebox recovery ratio, a ratio of fare revenues to current year and some non-current year costs. This number is not directly comparable to the FTA ratios mentioned above and provides a somewhat different perspective on the share of operating expenses borne by the MTA's component agencies. According to the MTA's calculations, the farebox recovery ratio for NYC Transit increased from 47 percent in 1994 to 56 percent for the first four months of 1999. The 1999 ratio was 38 percent for the Long Island Railroad, and 43 percent for Metro-North Railroad. |
| 2 | It has been argued that NYC Transit should receive a larger share because it carries a far greater number of passengers than the commuter railroads. |
| 3 | The $945 million total includes a $100 million annual contribution for six years, plus $345 million in bond proceeds which the city will give to NYC Transit in exchange for receiving the proceeds from the MTA's sale of the New York Coliseum. |
References
"Bart-SFO Airport Expansion: Partners and Funding." http://www.bart.org/westbay/about/partners.htm.
Richard Briffault, Elliott D. Sclar, and Walter Hook, Fairness and the Fare: Equity and Adequacy in the Financing of the Operating Agencies of the Metropolitan Transportation Authority (New York: Columbia University School of Law, 1998).
Metropolitan Transportation Authority:
New York City Transit, 1998 Operating Budget Proposal, December 18, 1997.
Office of the State Deputy Comptroller for New York City, Review of the Operating and Capital Plans for New York City Transit and the Commuter Railroads, Report 6-96, March 29, 1996.
"President’s Budget Promises Record Year for Transit Investment," http://www.fta.dot.gov/fta/docs/investment.html
"Queens Connector," http://www.fta.dot.gov/library/money/3jfund/1998/nyqueen1.htm.
Robert Zipf, How Municipal Bonds Work, (New York: New York Institute of Finance, 1995).