Closing the Fresh Kills landfill, the high cost of exporting refuse, and increasing labor costs are just some of the budgetary pressures the Department of Sanitation (DOS) will face in coming years. With half of DOS's budget allocated to garbage collection, competition for limited resources will increase pressure to make refuse collection more efficient. In this article, IBO looks at the costs of collecting garbage in New York City compared with other U.S. cities, and explores possible cost saving measures.
The Department of Sanitation collects over 3.5 million tons of garbage each year, including about 3 million tons of non-recycled refuse and more than 500,000 tons of recycled materials. IBO estimates department-wide spending will total roughly $800 million in 2000 growing to above $1 billion in 2003, with nearly half of this being spent for the collection of refuse and recycled materials. Work by IBO suggests that compared to other large cities, DOS has lower productivity and higher cost per ton of collections. Expected growth in the DOS budget resulting from increased garbage export and a new union contract makes seeking opportunities for reducing the cost of collections all the more timely. Examples of garbage collection productivity enhancements already being used in other major U.S. cities, such as managed competition (contracting out) and automated collection (where garbage trucks mechanically empty refuse containers), offer fertile ground for investigating ways in which New York City could increase productivity and bring down costs.
Collection productivity trends in New York City
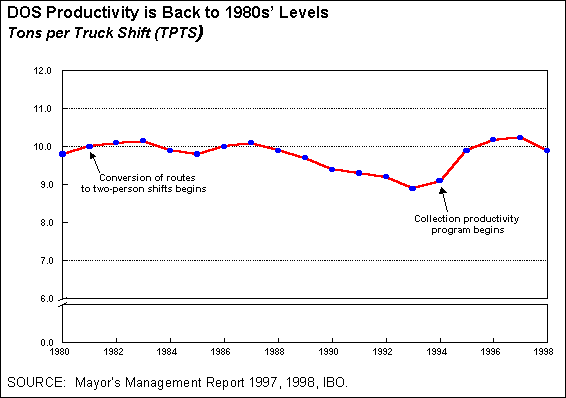
The New York City Department of Sanitation's overall level of collection productivity is measured in terms of tons of refuse per truck shift, or TPTS. IBO's review of productivity trend starts with the early 1980's when DOS converted collection routes from three person to two person crews. The current level of 9.9 TPTS is approximately the same as levels recorded through much of the 1980s. In general, collection productivity (TPTS) did not change significantly during the 1980s, but was followed by a dip in productivity in the early 1990s and improvements since 1994 when a collection productivity program began. In another effort to increase productivity, DOS recently negotiated an employment contract specificying an all-time high productivity goal of 10.6 TPTS and linked performance-based bonuses to meeting productivity targets.
Productivity and costs trends in other U.S. cities
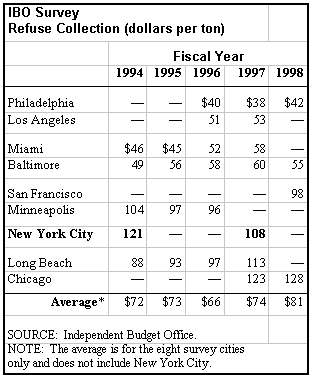
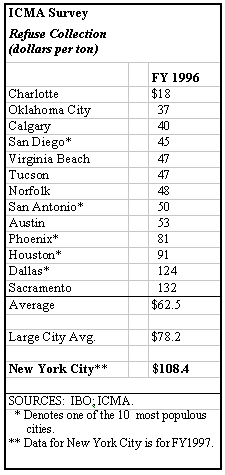
To assess how New York City's productivity and costs compare with those of other large cities, IBO surveyed 15 of the largest and most densely populated U.S. cities for TPTS and the cost of refuse collection. Eight cities responded to the survey-Baltimore, Chicago, Long Beach, Los Angeles, Miami, Minneapolis, Philadelphia, and San Francisco. Of those, only four cities provided TPTS data (Chicago, Miami, Minneapolis and Philadelphia), with the other cities reporting that either they do not calculate or do not make public TPTS statistics. All eight cities provided cost and tonnage data for refuse collections. Data from a separate survey conducted by the International City/County Management Association (ICMA) yielded the cost per ton for collecting refuse and recycling materials for an additional 13 U.S. cities, including several large cities.

TPTS levels. Chicago, Miami, Minneapolis, and Philadelphia all reported TPTS levels higher than New York City-ranging from 12.5 TPTS in Chicago to 15.3 in Miami. However, Miami and Philadelphia use three person crews to collect trash while Minneapolis and Chicago-like New York City-use two person crews. Adjusting for crew size, New York City's level of productivity at 9.9 TPTS is on par with that of Miami and Philadelphia, but remains well below productivity levels in Chicago (12.5 TPTS) and Minneapolis (14.0 TPTS).
Cost per ton. To measure cost efficiency, IBO calculated the cost per ton of trash collections. IBO was only able to calculate costs for collecting non-recycled refuse. These data suggest that, on average, New York City's costs are significantly higher than those of other large U.S. cities. In New York City, the cost per ton of collecting refuse was $121 in 1994 and $108 in 1997, compared with an average of $72 in 1994 and $75 in 1997 for the eight other large cities IBO surveyed. It appears, however, that New York City has been more effective at controlling cost increases over time than some other major cities. New York City's collection costs have fallen for the past five years, while costs have risen in most of the other cities surveyed.
Collection costs in the 13 cities ICMA surveyed averaged $63 per ton for (non-recycled) refuse in 1996. By comparison, the cost per ton of refuse collection in New York City (using 1997 data) was roughly 41 percent higher ($108 per ton). Looking at only the five largest cities in the ICMA study (Houston, San Diego, Dallas, Phoenix and San Antonio) the average cost was $78 per ton-nearly identical to the average cost of $75 from IBO's eight city survey.

Productivity Enhancement
Managed competition (contracting out) is one of the most commonly cited productivity measures for achieving large-scale reductions in the cost of refuse collection. In contracting out trash collection, cities may typically allow companies to compete against municipal workers to secure contracts for all or part of a city-or solicit bids only from private firms, awarding contracts to one or more companies. A number of researchers have studied the effects of contracting out municipal refuse collection to private firms. In terms of cost, they have found that significant savings, generally 25 percent to 30 percent, result from shifting to a competitive environment. For example, Barbara Stevens of Ecodata (a management consulting firm) surveyed 60 cities in 1994, finding that contracted collection was an average of 27 percent less costly than municipal collection. Similarly, in 1987, E.S. Savas reviewed independent productivity studies finding that contracting out saved an average of 26 percent over municipal collection. Moreover, savings generated through managed competition are recurring savings to the city budget.
 Examples of other productivity and management improvements being used in U.S. cities include volume pricing (a form of user charging), automated collection, and full cost accounting. In San Francisco, for example, contractors charge residents a monthly fee based on how much refuse they throw away. Automated collection is being used in Houston and Los Angeles where collection trucks are designed to accommodate standard containers that (once hooked on) are automatically dumped into the truck, eliminating manually lifting and emptying trash containers. In Miami, full cost accounting recognizes both direct costs (such as employment and equipment) and indirect costs (such as accounting and payroll) in budgeting for and reporting on the costs of trash collection.
Budget Implications
New York City collects about 3 million tons of non-recycled refuse each year. If New York City was able to achieve, for example, the 25 percent level of savings reported to be typical of cities that have shifted to managed competition, DOS would generate annual savings of $81 million-or more than 10 percent of the department's total annual budget. In general, however, the high volume of New York City's trash collections means that even small efficiency gains in the city's cost per ton of collections would yield significant budget savings. For example, at the city's 1997 rate of $108 per ton of collections, each $1 reduction would result in approximately $3 million in annual savings; a $5 reduction yields $15 million in savings; a $10 reduction generates $30 million in savings.
The fact that refuse collection in New York City is significantly more costly than in many other major cities suggests that there is room to improve DOS's collection costs. Examples of practices in many large U.S. cities suggest that such improvements can be made through a variety of productivity and management enhancements. It is important to note, however, that not all management enhancements offer equal benefits. Contracting out may potentially offer significant cost savings but be more difficult to implement, while other efficiency measures, such as automated collection, may offer more modest levels of savings but be easier to implement. DOS's impending budget pressures make this a good time for the city to explore its policy options for generating savings for New York City's sanitation program.
For more information about this issue, contact Mark Schreiner, Budget and Policy Analyst, at (212) 676-1364.