
December 2014
A Bright Budget Picture:
Jobs Increasing, Tax Revenues Rising,
Budget Gaps Shrinking
PDF version available here.
A Bright Budget Picture:
Jobs Increasing, Tax Revenues Rising,
Budget Gaps Shrinking
PDF version available here.
As Mayor Bill de Blasio prepared to take office about a year ago, some observers of New York’s fiscal condition voiced concerns about the potential for big new spending programs and a lack of budget discipline in the nascent mayoral administration. Based on the de Blasio Administration’s November 2014 Financial Plan for the city—which covers the current year, fiscal year 2015, through 2018—there is little evidence to give those concerns credence. Under the Mayor’s estimates in the November plan, budget shortfalls projected for the upcoming years are relatively modest, and new city-funded programmatic spending continues to be limited.
IBO’s latest projections of city revenue and spending under the contours of the Mayor’s November financial plan reflect an even brighter fiscal outlook than that anticipated by the de Blasio Administration. IBO projects the city will end the current fiscal year with a surplus of $744 million, $639 million more than estimated by the Mayor. Assuming that this year’s surplus is used to prepay some of next year’s expenses, we project the city will end 2016 with a very small shortfall of $184 million, roughly $1.7 billion less than de Blasio Administration’s gap estimate for next fiscal year. IBO also projects small surpluses for 2017 and 2018, years for which the Mayor anticipates shortfalls exceeding $1 billion.
The underlying strength in IBO’s local fiscal outlook is evident in a comparison of our projections of average annual growth in tax collections and city-funded spending from 2015 through 2018. While tax collections are expected to grow at a rate of 4.7 percent annually, we project city-funded spending will grow more slowly—at a rate of 2.9 percent annually, after adjusting for the use of last year’s surplus to prepay some of this year’s expenses.
IBO’s fiscal outlook for the city comes as the U.S. economy is adding jobs at the fastest pace since the 1990s and is expected to continue to do so over the next two years. Although the city is also experiencing very substantial increases in employment, we do not expect this job growth to spur extraordinary growth in tax revenues. This is a reflection of the city’s job increases coming in large part in lower paying sectors of the local economy and the continued expectation that Wall Street—formerly the driver of city job and tax revenue growth—will lag behind.
Barring a major deterioration
in the global economy or a resumption of political brinksmanship in
Washington over raising the debt ceiling, some of the biggest risks to
IBO’s fiscal outlook for the city may come from local spending needs.
One risk could come from still unsettled contracts with many of the
city’s uniformed workers—police, fire, sanitation, and correction.
Shortly after the release of the financial plan, which includes funding
for all city workers based on the settlement pattern with the teachers
union and District Council 37, the city reached a tentative pact with
eight unions representing 12,000 high ranking uniformed officers. This
deal departed a bit from the prior pattern and, if extended to all of
the uniformed unions, would cost about $460 million more than budgeted
over the four years of the financial plan based on IBO’s preliminary
estimate.
While the additional labor cost would dim the city’s otherwise bright fiscal outlook, it would not eclipse it. The financial plan includes substantial reserves, including a general reserve of $750 million for each year of the financial plan and $1.8 billion in the Retiree Health Benefits Trust. But labor is not the only factor that could darken the outlook.
Continued revenue shortfalls at agencies such as the Health and Hospitals Corporation and the New York City Housing Authority could also strain spending as projected under the financial plan. In June, the city quietly waived roughly $300 million in reimbursements for debt service and legal judgments owed by the hospitals corporation. Given the hospital agency’s ongoing shortfalls, the city may need to provide additional budget relief. Likewise, the housing authority may need additional fiscal relief from the city if some new initiatives fail to generate expected revenues—last fiscal year the city waived a $53 million reimbursement for the cost of policing housing authority developments.
|
Total Revenue and Expenditure Projections
Dollars in millions |
|||||
|
|
2015 |
2016 |
2017 |
2018 |
Average Change |
|
Total Revenue |
$77,473 |
$78,725 |
$81,429 |
$84,332 |
2.9% |
|
Total Taxes |
49,143 |
51,571 |
54,020 |
56,351 |
4.7% |
|
Total Expenditures |
77,473 |
78,910 |
81,009 |
84,117 |
2.8% |
|
IBO Surplus/(Gap) Projections |
$- |
$(184) |
$420
|
$214
|
|
|
Adjusted for Prepayments: |
|
|
|
|
|
|
Total Expenditures |
$78,850 |
$79,991 |
$81,210 |
$84,315 |
2.3% |
|
City Funded Expenditures |
$57,097 |
$58,784 |
$59,612 |
$62,201 |
2.9% |
|
NOTES: IBO projects a surplus of $744 million for 2015, $639
million above the de Blasio Administration’s forecast. The
surplus is used to prepay some 2016 expenditures, leaving 2015
with a balanced budget. Figures may not add due to rounding.
New York City Independent Budget Office |
|||||
U.S. and Local Economic Outlook
Economic Overview. After the substantial contraction of real gross domestic product (GDP) in the first quarter of 2014, the U.S. economy grew at some of the strongest rates since the Great Recession. (In this economic outlook section years refer to calendar years rather than fiscal years, and monthly and quarterly data is seasonally adjusted.) The economy is on pace to add more jobs this year than in any year since the late 1990s. IBO expects the current momentum to continue into 2015 and 2016. Barring serious deterioration in the global economy or major missteps in fiscal or monetary policy, real GDP growth will accelerate in 2015 and remain nearly as strong in 2016. With this growth, the unemployment rate—now 5.8 percent—is projected to continue falling over the next two years, prompting the Federal Reserve to begin raising interest rates sometime in 2015.
New York City is in the fifth year of very strong employment growth and is on pace to add what may be a record number of jobs in a single year once the official numbers are revised in March. IBO forecasts strong job gains to continue through 2016, accompanied by solid gains in personal income. About 55 percent of the projected employment gains will be in two sectors—education and health care and professional and business services—with the latter accounting for the largest share of wage gains. The city’s unemployment rate, which had been substantially higher than the nation’s for much of the post-recession period, has been falling rapidly and may converge with the national rate in the coming years.
U.S. Economy. Although IBO’s forecast for real GDP growth of 2.2 percent in 2014 is unchanged from 2013, the U.S. economy has gained momentum and the expansion is now self-sustaining. Investment and hiring by businesses have picked up at the same time that the drag from prior years’ contractionary fiscal policies and budgetary uncertainty has faded. The unemployment rate has fallen and there are recent indications that increased hiring and employment is beginning to push up wages. Aided by falling gas prices, increases in personal income are expected to boost consumer spending. Barring external shocks to the economy or debt-ceiling brinksmanship in Washington, IBO forecasts faster real GDP growth in the next two years: 3.5 percent in 2015 and 3.4 percent growth in 2016.
The U.S. economy’s recovery from the Great Recession has been slow and—until recently—uncertain. It was not until this past May, after 51 months of near-continuous job growth, that total U.S. employment finally surpassed its prerecession peak. Real GDP fell by an annual rate of 2.1 percent in the first quarter of 2014, due in part to the harsh winter weather that battered much of the country. But the economy subsequently rebounded, with output growing at annual rates of 4.6 percent and 3.9 percent in the second and third quarters, respectively.
The strength of the economy is evident in the labor market. So far this year (through November 2014), employment growth has averaged 241,000 per month—an increase not seen in any year since the late 1990s. The unemployment rate has continued a steady descent from its 9.9 percent peak during the recession (2009, fourth quarter) to 5.8 percent in November 2014. The U.S. unemployment rate would be considerably higher if not for the decline in labor force participation in recent years, as discouraged job seekers stopped looking for work and therefore were no longer counted in the labor force. Nearly a third of the jobless have been unemployed for more than 26 weeks—an unusually high share—and many of those employed part time would rather be working full time. There is less slack in labor markets, and payroll data suggests that real wages have begun to rise among workers who have not switched jobs. But recent wage gains have not been large enough or extensive enough to spark inflation above the Federal Reserve’s target rate. Though inflation this year has been somewhat greater than in 2013, it has been 2.0 percent or less every month, and IBO expects it to average 1.8 percent for the year.
Robust economic growth is expected to continue into 2015 and 2016, building on favorable conditions that have been in place for some time. The recession was the start of a prolonged period of deleveraging by businesses, banks, and households that over time has strengthened balance sheets. Businesses have reduced their operating costs, and real corporate profits have returned to prerecession highs. Banks are also better capitalized—the result of more stringent capital requirements in the wake of the financial crisis.
Helping to fuel economic activity is considerable pent-up demand for consumer goods and housing—much of it from young adults who deferred starting their own households during the recession and recovery. And the household sector is in a better position to spend. During the prolonged aftermath of the recession, household debt as a percentage of disposable (after-tax) income fell to lows not seen since the mid-1990s. The improved financial position of households and a gradual increase in consumer confidence have stimulated spending, particularly for autos and other durable goods. Notably, with the increase in consumption, household debt (other than for mortgages) has once again begun to rise, even as mortgage debt continues to shrink. Despite the years of deleveraging, total nonmortgage debt now exceeds its prerecession levels.
The demand for homes has also increased, spurred by a combination of strong job growth and very low interest rates. Home sales and prices have risen, spurring an increase in housing starts. However, tight mortgage lending standards for first-time homebuyers have made it difficult to enter the market. Policymakers are working to ease the regulatory impediments to first-mortgage lending, and change is slowly starting to occur. Another change that is already helping to bolster the market is that many builders are now putting up smaller homes with more affordable prices. The demand for rental housing remains very strong, bolstered by newly employed millennials who are not yet able to afford buying or do not qualify for mortgages. With vacancy rates at 20-year lows and capital readily available, construction of multifamily housing is expected to rise.
While U.S. economic growth has become strong enough to be self-sustaining, monetary policy is expected to continue to play a significant role in generating growth. The Federal Reserve has kept the federal funds rate on overnight loans between banks near zero and—until recently—had kept downward pressure on long-term interest rates by purchasing bonds (quantitative easing). Low rates have been critical in eventually reviving the market for housing, which had been a major impediment to growth in the aftermath of the Great Recession. The Federal Reserve’s policies have enabled banks and other financial firms to maintain their profitability even though revenues fell precipitously during the downturn and have yet to fully recover, by minimizing the cost of obtaining funds. With economic growth gaining momentum, we expect the Federal Reserve to engineer a gradual, orderly rise in interest rates beginning in 2015.
Economic growth accelerated this year in part because the fiscal drag created by previously adopted contractionary policies has abated. The expiration of emergency unemployment benefits was the only new contractionary fiscal policy in 2014, and its effects were largely felt early in the year. Moreover, there was only limited Congressional skirmishing over the federal budget and debt ceiling and no disruption of government operations this year as there were in 2013—developments which undermined consumer and business confidence. IBO’s forecast presumes no further political brinksmanship over raising the nation’s debt ceiling. It also assumes that government spending will not increase substantially in the coming years and that increases in revenue resulting from faster economic growth will continue to reduce the deficit.
Based on these assumptions IBO expects the robust economic growth of the last two quarters to continue in 2015 and into 2016. IBO forecasts 3.5 percent real GDP growth in 2015 and 3.4 percent growth in 2016—faster growth than in any year since 2005. For the first time since the 1990s, more than 3 million jobs will be added to the nation’s economy each year—3.2 million in 2015 (2.3 percent growth over 2014) and 3.6 million in 2016 (2.5 percent growth). Personal income growth is also projected to accelerate, from 4.4 percent this year to 6.2 percent next year and 6.8 percent in 2016—the result of employment growth, wage gains earned in a tightened labor market, greater interest income from higher interest rates, and other factors.
Robust growth will also put upward pressure on prices. The unemployment rate is already below the Federal Reserve’s previously announced 6.5 percent target of when it would begin to consider raising interest rates, though many observers inside and outside the Federal Reserve contend that the current unemployment rate may be overstating the strength of the recovery. At some point in 2015 we anticipate the Federal Reserve will begin gradually increasing the federal funds rate—from 0.1 percent currently to an average of 0.3 percent in 2015, 2.2 percent in 2016, and higher rates in the years thereafter. IBO expects the Federal Reserve to keep inflation to 2.1 percent in 2015, 2.4 percent in 2016, and to less than 3.0 percent in the following years.
IBO expects growth of both personal income and output to moderate after 2016, with real GDP growth slowing to 2.8 percent in 2017 and 2.3 percent in 2018. Despite slower economic growth, we expect the unemployment rate to continue its decline, reaching 5.0 percent by the end of 2018—a rate last seen in the first quarter of 2008.
Compared with IBO’s macroeconomic forecast, the Mayor’s Office of Management and Budget (OMB) projects slower real GDP growth in both 2015 (2.9 percent versus 3.5 percent for IBO) and 2016 (3.2 percent versus 3.4 percent). IBO’s and OMB’s forecasts of the unemployment rate are nearly identical. With slower growth, OMB also forecasts lower inflation than IBO in these years—1.7 percent in 2015 and 1.4 percent in 2016. After 2016, OMB forecasts slightly faster real GDP growth than IBO, although OMB continues to project little inflation, averaging only 2.0 percent in 2017 and 2018, compared with IBO which anticipates 2.8 percent and 2.9 percent inflation rates in those years.
Risks to the U.S.
Forecast. While the economic outlook for the U.S. economy
is now more favorable than it has been since the start of the Great
Recession, there are significant risks to the forecast. IBO’s economic
forecast is premised on there being no external shocks to the U.S.
economy, whether from oil prices or economic disruptions elsewhere in
the global economy. Over the next two years we expect oil prices to
return to $100 a barrel—well above the very low oil and gas prices
consumers have enjoyed in recent months. Unless there are sudden spikes
in oil prices, future increases in energy costs do not pose a risk to
the forecast.
A worsening of economic problems in countries other than the U.S.
perhaps poses a greater risk. Economic growth has slowed in Brazil and
Turkey—large emerging market economies which in recent years have been
bright spots in the global economy. With oil and natural gas accounting
for about 60 percent of its export earnings, the Russian economy has
been reeling this year from falling energy prices, the depreciation of
the ruble, and the impact of economic sanctions against it in response
to its invasion of Ukraine. The Japanese economy has now contracted for
two quarters in a row in spite of “Abenomics”—the mix of aggressive
monetary expansion, fiscal stimulus, and structural reforms aimed at
ending long-term economic stagnation.
Economic growth in the European Union continues to be slow at best and many countries are struggling to avoid stagnation and a third recession in seven years. The European Union makes up a substantial share of the global economy and is a major U.S. trading partner; further economic decline could have a big impact on global trade and financial markets including those in the U.S.
Economic problems in China, the world’s second largest economy, could also have a major impact on international trade and finance. The rapid export-led growth of the Chinese economy in recent years has become unsustainable, and reformers are aiming to refocus growth on domestic demand, though it is not clear how successful their efforts will be and if they can be carried out without major disruptions. Given New York City’s role as a global financial center, shocks from financial crises in Europe or China would have a major impact across all sectors of the city’s economy.
Finally, domestic policies pose a risk to our forecast. In the next year it will be tricky for the Federal Reserve to begin to raise the federal funds rate without generating sharp increases in long-term interest rates—increases which would have a negative impact on consumer spending and home sales. Another risk comes from the possibility of Congress again battling over the debt ceiling, which would undermine consumer and business confidence and potentially trigger another downgrade of U.S. debt.
The New York City Economy. The state of the city economy is currently strong. We are on pace this year for what may turn out to be (after revisions) the largest annual employment increase in the city’s history. Wage growth has also picked up again after several years of post-recession stagnation. The city’s unemployment rate is falling rapidly while labor force participation among city residents is growing.
IBO’s forecast anticipates two more years of robust employment growth (accompanied by moderate wage growth) before the pace slackens. The slowdown is partly a function of demographic shifts that are expected to slow the increase of the working-age population.
Employment Growth. New York City is completing the fifth year of a historically strong payroll employment expansion. In the 60 months since the last employment trough (October 2009), seasonally adjusted employment has increased by 413,800. But IBO estimates that the pending benchmark adjustment will revise the gain to over 436,000 (nearly 12 percent), the largest for any comparable period since records began in 1950.
For 2014 overall, the city is expected to add 85,800 jobs—the fourth straight year that annual average growth has topped 80,000. IBO projects that after the Bureau of Labor Statistics rebenchmarks its employment survey data to reflect the latest detailed reporting by firms, 2014 employment growth will total more than 100,000, surpassing the record set in 2000. The private-sector numbers are even stronger—average growth topping 90,000 (2.7 percent) over the past four years, and again rebenchmarking will push this even higher.
Barring negative shocks, IBO’s forecast calls for robust city job growth continuing through 2015 (just under 80,000) and 2016 (75,000). The pick-up in the pace of the national expansion—which until now has mostly lagged that of the city since the recession—will provide additional wind at the city economy’s back. After 2016 we expect both the national and city expansions to decelerate, though there will be enough momentum to produce further city employment increases of 57,000 in 2017 and 45,000 in 2018. Job creation will be constrained in part by diminished growth in the supply of labor (see below).
Wage Growth Finally Resumes. Over much of the post-recession period, the New York City jobs recovery was not matched by a recovery in wages and incomes. Indeed, adjusted for inflation the overall average wage was actually lower in 2013 than in 2010. The biggest decline was in the securities sector, but the weakness in wages was widespread in the city economy. This was a function both of weak wage growth within many sectors and of the relatively large share of the city’s employment gains occurring in sectors with lower average wages.
|
New York City
Wages–A Long-Awaited Recovery |
||||||||
|
|
Average Wages |
|||||||
|
2007 |
2008 |
2009 |
2010 |
2011 |
2012 |
2013 |
2014 |
|
|
All Jobs |
$88,977
|
$87,441
|
$80,441
|
$83,946
|
$84,679
|
$83,610
|
$82,976
|
$87,642
|
|
Growth |
5.6% |
-1.7% |
-8.0% |
4.4% |
0.9% |
-1.3% |
-0.8% |
5.6% |
|
Securities Sector |
$436,792
|
$419,161
|
$333,873
|
$380,353
|
$376,922
|
$366,570
|
$365,074
|
$426,149
|
|
Growth |
15.0% |
-4.0% |
-20.3% |
13.9% |
-0.9% |
-2.7% |
-0.4% |
16.7% |
|
All Other |
$70,783
|
$70,412
|
$68,469
|
$70,091
|
$70,850
|
$70,753
|
$70,724
|
$73,313
|
|
Growth |
2.4% |
-0.5% |
-2.8% |
2.4% |
1.1% |
-0.1% |
0.0% |
3.7% |
|
NOTE: In real 2014 dollars, 2014 is an estimate.
New York City
Independent Budget Office |
||||||||
But wages jumped in the first quarter of 2014. Wall Street (which enjoyed a strong bonus season) provided the biggest lift, but a notable surge was also evident across many of the other sectors that had formerly lagged. Assuming the gains hold across the rest of the year, this points to an estimated average annual wage of $87,642, a robust 5.6% increase over 2013. This is still shy of the 2007 peak, however.
Closer examination belies some of the story of a sudden strengthening of wages beginning in 2014. For one thing, the large bump in first quarter securities sector compensation may not have been entirely due to payments of end-of-2013 bonuses; some of what we were seeing was likely the cashing out of options issued as bonuses in lieu of cash in the fallout from the financial crisis.
In addition, 2014 may look somewhat better in terms of wages than it actually is because 2013 looks a bit worse than it actually was. The lack of overall average wage growth in 2013 was due entirely to an exceptionally bad first quarter, and this in turn was due in some measure to the widely anticipated federal tax increases that took effect in the beginning of the year, which prompted taxpayers who could vary the timing of their compensation to shift income back to 2012. We do not have a firm number for the amount of income back-shifted in New York City, but a partial estimate indicates that without the shift, the overall average wage would have grown in the neighborhood of 2.0 percent in 2013 followed by around 4.2 percent in 2014.
IBO forecasts a dip to 1.7 percent real average wage growth in 2015, just enough to finally carry the overall average wage above the precrisis peak. Over the rest of the plan period real wages are projected to grow 2.3 percent per year. The chief near-term uncertainty is what will happen with Wall Street bonuses early in 2015. Some signs (including the most recent survey by the compensation consulting firm Johnson Associates) point to a generally weak 2014-2015 securities bonus season. Other signals are more positive, including the prospect that cash-outs of prior-year options may again boost first quarter wages.
As can be seen in the charts below (left side panels), forecast employment growth will continue to be led—as it has been since before the Great Recession—by education and health services (27.9 percent of total employment growth) and professional and business services (27.0 percent), followed by trade (10.4 percent), leisure and hospitality (10.3 percent), and information (7.0 percent).
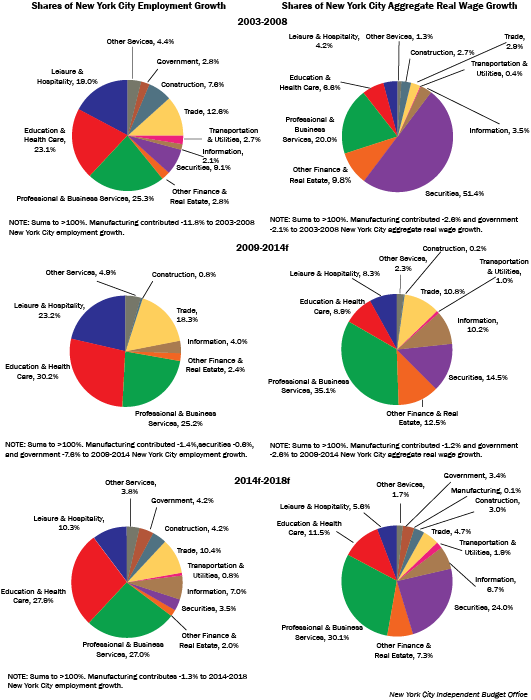
But there are two changes of note within the broader pattern. First, the city’s lowest-wage industries (retail trade, leisure and hospitality, social assistance, and personal services) are expected to account for about 30.0 percent of overall job growth from 2014 through 2018, considerably down from their 46.9 percent share in 2010 through 2014 and their 40.0 percent share from 2003 through 2008. Concomitantly, the share of job growth driven by midrange industries (defined here as those with average wages between $50,000 and $100,000 as of 2014) is on the upswing, rising from 25.0 percent in 2003 through 2008 to 31.1 percent from 2010 through 2014 to a projected 42.2 percent during 2014 through 2018.1
Second, the securities sector was a significant source of employment growth before the recession, but has contributed nothing to overall employment change in the aftermath of the crisis—though that is now starting to change as the industry shows signs of modest but positive growth again.
But no return to the securities sector’s precrisis dominance of the city’s aggregate wage growth is forecast. Before the Great Recession securities accounted for over half of the city’s aggregate real wage growth. But with fewer workers and lower average wages for those who are working, the role of the securities sector in the current expansion and forecast is less outsized. Professional and business services are now expected to account for the largest share of aggregate real wage growth (right side panels).
Hours Worked. One of the few local economic indices that have not been showing strength is hours worked. While record numbers of workers are employed today in New York City, they are not, on average, working as long as they used to. The average work week of private-sector employees fell sharply in the recession and is still slipping. Through October, average weekly hours worked was down 3.5 percent since 2008. As a result, while private payroll employment over the first nine months of 2014 was 8.4 percent higher than over the same period in 2008, aggregate hours worked—perhaps a truer measure of the total increase in the demand for labor—was only 4.6 percent higher.
IBO estimates that about a fifth of decline in average hours worked is a function of changes in New York City’s industry mix—the growing share of relatively lower-wage, shorter-hour jobs in economy—while the remaining four-fifths is due to shrinking hours within industries. As IBO is forecasting more evenly distributed city job growth among low, medium, and high-wage sectors over the next few years than we have seen in the past few, this might somewhat attenuate the overall trend towards fewer work hours.
Income. Growth in nominal personal income is on track to jump from a very weak 2.0 percent in 2013 to 7.2 percent in 2014, a pace exceeded only four times in the last quarter century (10.1 percent in 1990, 7.4 percent in 2000, 9.3 percent in 2006, and 10.0 percent in 2007). But here again appearance is somewhat distorted by the tax policy induced shifting of wages from 2013 to 2012, discussed above. Absent this shift, income growth rates would have been more on the order of 3.6 percent in 2013 and 6.4 percent in 2014. That would still leave 2014 as the strongest year for personal income growth since the crisis.
IBO expects income growth to subside somewhat over the forecast period, running in the range of about 5.9 percent annually over 2015 and 2016 and 5.2 percent per year over 2017 and 2018.
Labor Force. Despite the city’s exceptionally robust payroll employment growth since the recession, the unemployment rate for city residents remained high for years while the national rate fell. But now the city’s unemployment rate is dropping rapidly, falling 2 percentage points over the past 12 months (8.4 percent to 6.4 percent) and converging on the national rate (currently 5.8 percent). IBO expects another 1 percentage point drop in the city unemployment rate over the next year.
The usefulness of the unemployment rate as a signal of labor market slack has been compromised in recent years by the sharp slump in the U.S. labor force participation rate since the recession. It is clear that some part of the decline in the number of unemployed at the national level reflects people either aging out or dropping out of the work force rather than people finding employment. It is not yet fully clear how much of the decline in labor force participation has been cyclical, how much has been due to policy changes, and how much is a function of underlying demographic trends.
In New York City, meanwhile, labor force developments have followed a markedly different path, for as labor force participation rates fell from 66.2 percent in 2008 to 63.0 percent in 2014 in the rest of the country, participation here actually rose slightly over the same period, increasing from 59.5 percent to 60.3 percent. This may supply part of the explanation as to why the decline in the unemployment rate lagged in the city even as payroll employment growth here was much stronger, namely that the city rate was not depressed by a surge in labor force dropouts to the same degree as the national rate.
IBO projects exceptionally strong labor force growth in the city through 2017, followed by a marked slowdown. The latter is a function of a shrinking cohort of younger people reaching the age when they enter the labor force and a growing cohort of older workers reaching the age of retirement. The lower labor force growth is expected to eventually impose constraints on the growth in payroll employment, income, and output, though the strong city economy may continue to prompt—and be aided by—in-migration of working-age adults.
Real Estate. The city’s real estate market continues its strong comeback since the crash of 2008. Based on sales through November, the total value of real estate sales in New York City in 2014 will likely surpass the 2013 total of $105.7 billion, which up to now was the second-highest total on record (exceeded only by 2007).
The recovery in real estate markets has been especially strong in the commercial sector, which declined more sharply than the residential sector during the crash. Sales of commercial properties have greatly exceeded those of residential properties for the last three years. From January through November 2014, taxable commercial sales were $62.3 billion, compared with taxable residential sales of $38.5 billion.
IBO projects that higher interest rates beginning in 2015 will put a damper on property markets. The value of transactions and median housing prices will continue to rise, but at a slower rate.
Wall Street. Broker-dealer profits of New York Stock Exchange member firms are running at about $15 billion this year, and are projected to grow from roughly $16 billion to $18 billion per year over the 2015-2018 period. These are comparable to good (but not record) precrisis figures, but are the product of a much changed environment in terms of broker-dealer revenues and expenses.
The most striking difference is that broker-dealer operating (noninterest) revenues plunged in 2008 and at an estimated $172 billion in 2014 remain nearly 50 percent below their precrisis peak. Virtually all the decline is accounted for by the implosion of revenues generated by firms trading on their own accounts—a casualty first of the collapse of those markets during the crisis and then of a post-crisis regulatory regime reining in bank risk-taking.
Wall Street continues to show profits now primarily because net interest costs are also miniscule compared to the pre-crisis era: just 4.5 percent of operating revenue in 2014, as opposed to 68.3 percent of operating in 2007. One has to go back to the late 1970s to find net interest costs as low.
IBO expects modest broker-dealer revenue growth over the next four years, bringing operating revenue up to about $200 billion by 2018. The industry’s growth will be constrained by the new regulatory environment, but net interest costs will also remain relatively low, rising to just 11 percent of operating revenue by 2018.
|
IBO versus Mayor’s Office of Management and Budget Economic
Forecasts |
|||||||
|
|
2012 |
2013 |
2014 |
2015 |
2016 |
2017 |
2018 |
|
National Economy |
|
|
|
|
|
|
|
|
Real GDP Growth |
|
|
|
|
|
|
|
|
IBO |
2.8 |
2.2 |
2.2 |
3.5 |
3.4 |
2.8 |
2.3 |
|
OMB |
2.8 |
2.2 |
2.2 |
2.9 |
3.2 |
3.1 |
2.5 |
|
Inflation Rate |
|
|
|
|
|
|
|
|
IBO |
2.1 |
1.5 |
1.8 |
2.1 |
2.4 |
2.8 |
2.9 |
|
OMB |
2.1 |
1.5 |
1.9 |
1.7 |
1.4 |
1.9 |
2.1 |
|
Personal Income Growth |
|
|
|
|
|
|
|
|
IBO |
4.2 |
2.0 |
4.4 |
6.2 |
6.8 |
5.9 |
5.0 |
|
OMB |
4.2 |
2.0 |
4.1 |
4.6 |
5.5 |
5.9 |
5.1 |
|
Unemployment Rate |
|
|
|
|
|
|
|
|
IBO |
8.1 |
7.4 |
6.3 |
5.7 |
5.5 |
5.3 |
5.2 |
|
OMB |
8.1 |
7.4 |
6.2 |
5.8 |
5.5 |
5.2 |
5.1 |
|
10-Year Treasury Bond Rate |
|
|
|
|
|
|
|
|
IBO |
1.8 |
2.3 |
2.7 |
3.4 |
4.5 |
4.7 |
4.5 |
|
OMB |
1.8 |
2.4 |
2.7 |
3.4 |
3.8 |
4.2 |
4.2 |
|
Federal Funds Rate |
|
|
|
|
|
|
|
|
IBO |
0.1 |
0.1 |
0.1 |
0.3 |
2.2 |
3.6 |
4.1 |
|
OMB |
0.1 |
0.1 |
0.1 |
0.3 |
2.0 |
3.6 |
3.7 |
|
New York City Economy |
|
|
|
|
|
|
|
|
Nonfarm New Jobs (thousands) |
|
|
|
|
|
|
|
|
IBO |
79.5 |
83.1 |
85.8 |
79.5 |
74.9 |
56.9 |
45.3 |
|
OMB |
80.0 |
83.0 |
78.0 |
53.0 |
56.0 |
58.0 |
47.0 |
|
Nonfarm Employment Growth |
|
|
|
|
|
|
|
|
IBO |
2.1 |
2.1 |
2.2 |
2.0 |
1.8 |
1.4 |
1.1 |
|
OMB |
2.1 |
2.1 |
2.0 |
1.3 |
1.4 |
1.4 |
1.1 |
|
Inflation Rate (CPI-U-NY) |
|
|
|
|
|
|
|
|
IBO |
2.0 |
1.7 |
1.7 |
2.5 |
2.9 |
3.3 |
3.3 |
|
OMB |
2.0 |
1.7 |
1.7 |
1.9 |
1.7 |
2.1 |
2.2 |
|
Personal Income ($ billions) |
|
|
|
|
|
|
|
|
IBO |
479.2 |
488.0 |
523.3 |
553.5 |
587.2 |
618.9 |
649.6 |
|
OMB |
466.2 |
478.1 |
497.7 |
511.2 |
532.7 |
559.9 |
584.3 |
|
Personal Income Growth |
|
|
|
|
|
|
|
|
IBO |
3.7 |
2.0 |
7.2 |
5.8 |
6.1 |
5.4 |
5.0 |
|
OMB |
2.3 |
1.2 |
4.1 |
2.7 |
4.2 |
5.1 |
4.4 |
|
Manhattan Office Rents ($/sq.ft) |
|
|
|
|
|
|
|
|
IBO |
66.7 |
68.4 |
70.5 |
72.4 |
75.1 |
77.2 |
79.6 |
|
OMB |
67.9 |
68.9 |
71.5 |
73.9 |
77.6 |
79.9 |
83.0 |
|
SOURCE: Mayor’s Office of Management and Budget
NOTES: Rates reflect year-over-year percentage changes except
for unemployment, 10-Year Treasury Bond Rate, Federal Funds
Rate, and Manhattan Office Rents. The local price index for
urban consumers (CPI-U-NY) covers the New York/Northern New
Jersey region. Personal income is nominal. For 2013, New York
City personal income and growth rates are estimated, pending
Bureau of Economic Analysis release.
New York City
Independent Budget Office |
|||||||
Taxes and Other Revenues
IBO’s forecast of revenue from taxes and other sources including fines, fees, and state and federal aid totals $77.5 billion for this year—an increase of $4.1 billion (5.5 percent) over 2014. Much of this increase is due to a 15.2 percent increase in state and federal grants—which had been swelled by the receipt of federal aid for Sandy relief efforts. Tax revenue growth from 2014 to 2015 is forecast to be a more typical 3.4 percent. Our forecast of total revenue for 2016 is $78.7 billion, a modest increase of 1.6 percent, dragged down by a 12.4 percent decline in federal aid.
While total revenue growth is expected to be tepid from this year to next, IBO expects the tax revenue portion of that total to increase more strongly, rising by $2.4 billion (4.9 percent) to $51.6 billion in 2016. In contrast, the city’s own nontax revenues (primarily fees, fines, and asset sales) for 2016 are projected to fall by $593 million (-9.0 percent) from their current year total to $5.9 billion. Noncity revenues in 2016 are expected to be 5.4 percent lower than in 2015, thanks to the drop in federal grants.
Following 2016, IBO projects that total revenues will grow in a more typical pattern, increasing to $81.4 billion in 2017 and $84.3 billion by 2018. Annual revenue growth will average 3.5 percent in these years, driven by city taxes, which are forecast to increase at an average annual rate of 4.5 percent. Growth in noncity revenue sources is projected to average 2.1 percent annually in 2017 and 2018.
The first part of this section presents IBO’s tax revenue forecast, followed by a detailed discussion of each of the city’s major tax sources. It concludes with a brief overview of the outlook for nontax revenues.
Tax Revenues. IBO’s forecast for tax revenues in the current fiscal year is $49.1 billion, an increase of 3.4 percent from 2014. Revenue growth is slower this year than in 2014 for several of the city’s major taxes, most notably the real property transfer tax and mortgage recording tax, which both saw double-digit increases in 2014 but in the aggregate are expected to decline slightly this year. For 2016, IBO projects somewhat faster revenue growth of 4.9 percent to $51.6 billion.
The tax revenue growth for 2016 is expected to come from across most of the city’s taxes. Particularly large gains are expected in the business income taxes—an increase of $522 million (8.4 percent)—thanks to strength in sectors such as professional and business services and information, and from the personal income tax, where another year of strong employment and personal income growth will help revenues increase by $590 million (6.1 percent).
For 2017 and 2018, IBO expects continued tax revenue growth averaging 4.5 percent annually. Tax revenues are forecast to reach $56.4 billion by 2018. Business income taxes and the property tax in particular are expected to experience strong growth over those two years.
Continued difficulties in the
securities industry, including depressed aggregate earnings, minimal
increases in employment, and an expectation of little increase in
profits mean that Wall Street is unlikely to account for much new tax
revenue for the city. IBO expects growth in the securities sector—along
with growth in the sector’s contribution to city tax revenues—to remain
relatively modest compared with growth during the pre-2008 expansion or
even the more recent years of slow recovery.
IBO’s forecast does not include double-digit tax revenue growth,
something that did occur each of the boom years from 2004 through 2007.
Nor does IBO’s forecast assume an acceleration of growth over the recent
past. Indeed, the average annual growth projected for 2014 through
2018—4.3 percent—is one-third less than the annual average rate that
occurred over the preceding four years (2011 through 2014).
Compared with the city’s revenue forecast when the 2015 budget was adopted last spring, IBO’s new forecast is $1.4 billion (2.9 percent) higher for this year and our outlook for 2016 is $1.6 billion (3.1 percent) above the adopted budget estimate. The strength in 2015 collections is not entirely surprising—IBO’s estimates last spring suggested that the city was underestimating 2014 revenues by almost $700 million. Moreover, the local labor market and real property assessments have proved to be even stronger than expected last spring, prompting an upward revision in our forecast for 2015 tax revenue of $708 million, with the largest changes made to the personal income tax and real property tax forecasts. We made more modest adjustments of between $500 million and $700 million to our projections from last spring for 2016 through 2018.
IBO’s latest tax revenue forecast for 2015 is $621 million, or 1.3 percent, higher than the OMB forecast that accompanied the November 2014 Financial Plan. The gap between the two forecasts grows each year, from $1.3 billion in 2016 to $2.3 billion in 2018, when IBO’s forecast of total tax revenues exceeds OMB’s by 4.2 percent.
|
IBO Revenue Projections
Dollars in millions |
|||||
|
|
2015 |
2016 |
2017 |
2018 |
Average Change |
|
Tax Revenue |
|
|
|
|
|
|
Property |
$21,058
|
$22,074
|
$23,167
|
$24,334
|
4.9% |
|
Personal Income
|
9,615
|
10,206
|
10,660
|
10,949
|
4.4% |
|
General Sales |
6,715
|
7,010
|
7,294
|
7,580
|
4.1% |
|
General Corporation |
3,017
|
3,215
|
3,410
|
3,606
|
6.1% |
|
Unincorporated Business |
2,025
|
2,254
|
2,449
|
2,626
|
9.1% |
|
Banking Corporation |
1,142
|
1,236
|
1,283
|
1,353
|
5.8% |
|
Real Property Transfer |
1,412
|
1,504
|
1,573
|
1,622
|
4.7% |
|
Mortgage Recording |
962
|
1,021
|
1,068
|
1,109
|
4.9% |
|
Utility |
411
|
427
|
443
|
458
|
3.6% |
|
Hotel Occupancy |
549
|
596
|
626
|
657
|
6.2% |
|
Commercial Rent |
744
|
762
|
783
|
795
|
2.2% |
|
Cigarette |
52
|
50
|
48
|
46
|
-4.0% |
|
Other Taxes and Audits |
1,441
|
1,217
|
1,217
|
1,217
|
-5.5% |
|
Total Taxes |
$49,143
|
$51,571
|
$54,020
|
$56,351
|
4.7% |
|
Other Revenue |
|
|
|
|
|
|
STaR Reimbursement |
$856
|
$848
|
$855
|
$862
|
0.3% |
|
Miscellaneous Revenue |
5,737
|
5,115
|
4,971
|
5,018
|
-4.4% |
|
Unrestricted Intergovernmental Aid |
-
|
-
|
-
|
-
|
n/a |
|
Disallowances |
(15) |
(15) |
(15) |
(15) |
n/a |
|
Total Other Revenue |
$6,577
|
$5,948
|
$5,811
|
$5,866
|
-3.7% |
|
Total City Funded Revenue |
$55,720
|
$57,519
|
$59,830
|
$62,217
|
3.7% |
|
State Categorical Grants |
$12,442
|
$12,844
|
$13,323
|
$13,843
|
3.6% |
|
Federal Categorical Grants |
7,894
|
6,915
|
6,827
|
6,825
|
-4.7% |
|
Other Categorical Aid |
871
|
914
|
910
|
905
|
1.3% |
|
Interfund Revenue |
545
|
533
|
540
|
541
|
-0.2% |
|
TOTAL REVENUES |
$77,473
|
$78,725
|
$81,429
|
$84,332
|
2.9% |
|
NOTE: Figures may not add due to rounding.
New York City Independent Budget Office |
|||||
Real Property Tax. IBO projects property tax revenue will grow from $21.1 billion in 2015 to $22.1 billion in 2016, a 4.8 percent increase. From 2014 through 2018, we expect property tax revenue to grow at an average annual rate of 5.1 percent. This revenue growth is primarily due to IBO’s projection that the property tax levy, which is determined by multiplying each property’s assessed value by the appropriate tax rate, will grow on average 4.9 percent through 2018. By comparison, OMB expects average annual increases in revenue and levy of 4.6 percent and 4.7 percent, respectively.
Background. The amount of tax owed on real estate in New York City depends on the type of property, its value for tax purposes (as calculated by the city’s Department of Finance from estimated market value), and the applicable tax rate.2 Under property tax law, there are four classes of property: Class 1 consists of one-, two-, and three-family homes; Class 2 comprises apartment buildings, including cooperatives and condominiums; Class 3 is exclusively real property owned by utility companies; and Class 4 consists of all other commercial and industrial property. Each class’s share of the levy is determined under a state law designed to allow only small shifts in the share of the overall property tax borne by each class. The city then divides the apportioned citywide levy by the taxable assessed value of property for each class, resulting in a class-specific tax rate, or how much a taxpayer owes per $100 of their property’s taxable value.
The taxable assessed value of a property for tax purposes is established by the Department of Finance. The department estimates each property’s fair market value and then applies an assessment ratio, which reduces the amount of the property’s value subject to the property tax. For Class 1 property, no more than 6.0 percent of fair market value is taxable while for all other property 45.0 percent is taxable. A property’s resulting assessed value is then further reduced by any qualified property tax exemptions in order to reach taxable assessed value.
Because of differences in assessment ratios, exemptions, and assessment practices across property types, the share of taxable assessed value borne by each class is not proportional to its share of market value. Class 1 properties account for a much smaller share of total assessed value than their share of market value—9.2 percent of assessed value on the 2015 roll compared with 45.8 percent of the department’s estimate of total market value in the city. The other classes, especially Classes 3 and 4, bear a disproportionately larger share of the property tax burden because their shares of assessed value are much bigger than their shares of market value.
Assessment Roll for 2016. The tentative assessment roll for 2016 is scheduled for release in January 2015. After a period for appeals and review, a final roll will be released in May. IBO projects that aggregate market value on the final roll will be 5.6 percent greater than on last year’s roll, while assessed value for tax purposes is forecast to grow by 5.3 percent.
Class 1. The aggregate market value of Class 1 properties is expected to grow 3.6 percent in 2016. This increase reflects modest growth in the sales price of the median single-family home in the outer boroughs, which—as of October—was $435,000. While the median price is still below its peak of $445,000 in 2008, strong growth over the last two years suggests that Class 1 market values will return to prerecession levels by 2017 if current sales price trends continue.
IBO projects assessed value for tax purposes in 2016 will increase by 2.4 percent over 2015. In Class 1, the assessed value of a property moves toward a target of 6.0 percent of market value, with assessment increases capped at 6.0 percent a year or 20.0 percent over five years. If a parcel is assessed under the cap, its assessed value will grow each year until it hits the target ratio of 6.0 percent of market value or it reaches the cap—even if the market value stays flat or declines compared with the prior year. When the housing market was strong, the median ratio for one-family homes outside Manhattan declined from 5.4 percent in 2004 to a low of 3.7 percent in 2008, well below the 6.0 percent target. More recently, the median assessment ratio has increased, rising from 4.0 percent in 2009 to 5.4 percent in 2015.
Class 2 and Class 4. IBO projects that on the final roll for 2016, aggregate market value for all properties in Class 2 will total $234.4 billion, an 8.6 percent increase over 2015. This is the strongest growth in market value for condos, coops, and rental properties since 2008. Class 4 aggregate market value is expected to reach $262.4 billion, a 6.4 percent increase over 2015—this would be the fifth consecutive year of annual growth greater than 5.0 percent. Aggregate assessed value for tax purposes for Class 2 is expected to be $65.8 billion, a 3.6 percent increase from the 2015 roll, and $96.3 billion for Class 4, a 6.8 percent change from the previous year. The increase projected for Class 2 is below average growth in market value over the past five years (5.1 percent), while the increase forecast for Class 4 is above its five-year average of 5.9 percent.
The continued positive growth of Class 2 and Class 4 assessments for tax purposes is partly attributable to the city’s method for translating changes in market value into assessed value. In most cases changes in parcels’ market values are phased in over five years. The assessed value changes from the preceding four years that have yet to be recognized on the tax roll are called the pipeline. IBO’s assessed value projections reflect an improving market over recent years that has allowed the pipeline to increase threefold from $6.3 billion in 2011 to $17.1 billion in 2015. The pipeline’s current level eclipses the previous high of $15.7 billion in 2009, which reflected net pipeline growth at the peak of the housing bubble.
Outlook for Market and Assessed Values in 2017 and 2018. Market value growth is expected to slow after 2016. IBO forecasts an increase in aggregate market value of 3.6 percent in 2017, with each class projected to realize slower growth compared with 2016. Market value in 2017 is expected to rise 1.0 percent in Class 1, 5.3 percent in Class 2, and 6.3 percent in Class 4, with similar increases forecast for 2018.
IBO projects that aggregate assessed value for tax purposes will grow by 5.1 percent in 2017 and by 5.3 percent in 2018. Class 1 assessed value for tax purposes is expected to grow by about 2.7 percent in both years. With the pipeline exceeding its prerecession levels, taxable assessed value in Classes 2 and 4 are each projected to increase at a relatively stable pace through 2018. Class 2 will grow 4.3 percent in 2017 and 4.5 percent in 2018, while we expect the Class 2 pipeline—estimated at $6.6 billion following the 2015 final roll—to reach $7.5 billion in 2018. Meanwhile, Class 4 growth in taxable assessed value will be even stronger, increasing 6.3 percent in 2017 and 6.5 percent in 2018. IBO estimates that the Class 4 pipeline was $10.5 billion in 2015 and will grow to $11.7 billion by 2018.
Revenue Outlook.3 IBO anticipates property tax revenue will total $21.1 billion at the close of 2015 and $22.1 billion in 2016—an increase of 4.8 percent. Growth is expected to average 5.0 percent annually over the next two years, with revenue reaching $24.3 billion in 2018. In contrast, OMB forecasts 2015 revenues of $21.0 billion and average annual growth of 4.5 percent through 2018, when property tax revenue is projected to total $23.9 billion.
The amount of property tax
revenue the city collects in any fiscal year is determined not just by
the levy, but also by tax delinquencies, abatements granted by the city,
refunds for disputed assessments, and collections from prior years. Part
of the difference between IBO’s and OMB’s property tax revenue
projections is also attributable to differences in forecasting these
other factors.
IBO’s revenue forecast differs from OMB’s most significantly with
respect to the condo and coop abatement, prior year collections, and
real property tax refunds. Regarding the abatement, IBO expects the
program will cost the city $404 million in 2015 compared with OMB’s
projection of $416 million. By 2018, IBO estimates the abatement will be
$460 million; OMB expects the abatement will cost the city $473 million
in 2018. For more information on the abatement’s economic and policy
implications, see our January 2013
analysis.
IBO’s estimate of prior year collections in 2015 exceeds OMB’s forecast by $55 million. We expect prior year collections to grow at a steady rate through the forecast period, culminating in $328 million in 2018 compared with OMB’s projection of $293 million. Meanwhile, IBO expects to pay less in refunds than OMB. We project that the city will refund an average of $364 million annually while OMB expects refunds to average $497 million a year.
Combining our stronger levy
forecast with our forecasts of these other revenue components, IBO’s
estimate of total property tax revenue exceeds OMB’s from 2015 through
2018 by $90.5 million, $105.2 million, $248.0 million, and $755.0
million, respectively.
Finally, IBO’s property tax revenue forecast for 2015 reflects changes
in the state’s administration of the School Tax Relief program (STAR).
STAR provides a property tax exemption for primary residences. Beginning
in fiscal year 2014, STAR recipients are required to register with the
state, a policy response to some individuals owning multiple homes
throughout the state and claiming multiple STAR exemptions. Previously,
administration of the program was handled locally making it difficult
for assessors to determine if a recipient owned other homes in the state
(for more information, see IBO’s December 2013
blog). City homeowners who receive Basic STAR benefits can enjoy a
partial property tax exemption of up to $305 in 2015. The registration
requirement will not affect the city’s financial situation because the
state reimburses localities for whatever revenue is lost due to
homeowners taking the STAR exemption. If the new registration
requirement reduces the number of STAR recipients thereby generating
additional tax revenue, the reimbursement from the state will be
adjusted downward. As of March 2014, 80 percent of city recipients had
registered, up from 53 percent through November 2013. We estimate that
the 20 percent of city homeowners who failed to register will lose out
on $29 million in state property tax relief in 2015. However, IBO
anticipates the registration number will climb modestly in 2016 as more
residents realize their STAR benefits were eliminated.
Real Estate Transfer Taxes. Revenues from the real property transfer tax (RPTT) and the mortgage recording tax (MRT)—collectively referred to as the transfer taxes—continued their strong growth in 2014. Thanks to a surge toward the end of the year, the two taxes together brought in almost $2.5 billion, about 3.5 percent more than IBO forecast in May 2014. For 2015, IBO expects a slight decline in the sum of RPTT and MRT revenue, to $2.4 billion. By 2018 combined revenues from the two taxes are projected to reach $2.7 billion—still 17.0 percent below the 2007 peak of $3.3 billion.
RPTT revenues were just over $1.5 billion in 2014, a jump of 40.7 percent from 2013, and the second-highest collection on record after the 2007 peak of $1.7 billion. The sale in June 2014 of three properties each valued at over $1 billion contributed significantly to these results. Increases in RPTT revenue closely track growth in the value of real property sales. Because commercial properties are taxed at a higher rate than residential properties, and properties valued over $500,000 are taxed at a higher rate than lower-valued ones, RPTT collections vary with both the level and composition of real estate sales. The jump in RPTT revenue in 2014 was due primarily to the sharp increase in the aggregate value of taxable commercial sales, which grew 52.1 percent over 2013, compared with a 26.3 percent increase in the value of taxable residential sales. Overall, commercial properties represented 59.0 percent of the total value of taxable real estate sales in 2014.
The predominance of commercial sales has continued into 2015. In the first four months of the fiscal year, commercial properties accounted for 57.3 percent of the value of taxable real estate sales and 60.2 percent of RPTT receipts; more than two-thirds of the revenue attributable to commercial sales has come from properties in Manhattan. There were 38 taxable commercial sales valued at over $100 million in the first four months of 2015, compared with 33 such sales during the same period of 2014. The largest transaction so far this year has been the $750 million sale of 65 East 55th Street (the Park Avenue Tower), recorded in August.
In response to the strength of collections so far this fiscal year, IBO has raised its 2015 forecast of RPTT revenue slightly over our May 2014 projections, though for the latter half of the fiscal year commercial sales are expected to return to more normal levels. The 2015 forecast of $1.4 billion is $115 million (7.6 percent) below 2014 RPTT receipts. Our forecast for 2016 through 2018—which is essentially unchanged since May—projects annual average growth of 4.7 percent over the three years. By 2018 revenues are forecast to exceed $1.6 billion, roughly 94 percent of their 2007 peak.
MRT revenues fell more sharply than RPTT collections after the peak, and have recovered more slowly. MRT revenue reached $961 million in 2014, an increase of 29.5 percent over 2013, but still well below the 2007 peak of almost $1.6 billion.
The MRT does not track the value of real estate sales as closely as does the RPTT, because not all sales involve a mortgage. Moreover, for sales with a mortgage, the ratio of the mortgage to the sale price varies widely from one transaction to another. All-cash sales are common in the city’s luxury housing market, both among U.S. residents and the foreign buyers who are believed to account for a considerable share of high-end residential purchases. If foreign buyers obtain financing overseas, no mortgage is recorded in New York City, and no MRT liability is incurred. Finally, most mortgage refinancings are taxed, but do not involve a sale.
Historically, high MRT collections have generally corresponded to periods of low interest rates and significant refinancing activity. As with our forecast for the RPTT collections, IBO has increased its 2015 forecast for the MRT based on the strength of collections from July through October. While in May IBO projected a small decline in MRT revenues for this year, we now forecast $962 million in MRT collections—essentially the same as in 2014. Based on data from the Mortgage Bankers Association, IBO anticipates a decline in refinancing activity beginning in calendar year 2015. While recent news accounts have reported that residential lending standards have loosened somewhat, after many years of very low interest rates it is likely that most mortgage holders who would benefit from refinancing and are able to access credit have already refinanced, so these changes are not expected to result in a surge in mortgage activity. In contrast, mortgage rates are projected to increase beginning in calendar year 2015 and continuing into 2016, which will depress mortgage activity, particularly refinancings. After 2015, IBO forecasts growth in MRT revenue averaging 4.9 percent a year through 2018. MRT collections are projected to reach just over $1.1 billion in 2018—still 29.4 percent below the 2007 peak.
IBO’s projections for both RPTT and MRT are slightly above OMB’s for each year of the financial plan. For the 2014-2018 period, our RPTT and MRT forecasts are 2.7 percent and 3.3 percent, respectively, above OMB’s. IBO’s higher forecasts for transfer tax revenues are attributable in part to our expectation of faster employment and personal income growth than OMB projects.
Commercial Rent Tax. Revenue from the commercial rent tax (CRT) has risen substantially in recent years, and the 7.0 percent growth of 2014 was the highest since 2007, before the financial crisis hit. Stronger-than-expected collections during the first four months of the fiscal year have led IBO to increase our forecast of 2015 CRT revenue to $744 million, $34 million (4.7 percent) above 2014 and $16 million more than we forecast in May. The same intense activity in commercial real estate markets that has caused a surge in RPTT and MRT revenues has pushed up average rents and leasing activity. After 2015, we expect slower growth in CRT revenues, averaging 2.2 percent annually through 2018. By 2018, CRT revenues are forecast to reach $795 million, 11.9 percent over the 2014 level.
The CRT is a tax imposed on tenants who rent space for business, professional, or commercial purposes in areas of Manhattan below 96th Street. Not-for-profit entities, subtenants, tenants located in the World Trade Center area, and tenants located in the Commercial Revitalization Program abatement zone are all exempt from the tax. Over time both the tax rate and the geographic area subject to the tax have been reduced. Currently, tenants whose annual gross rents are less than $250,000 are exempt from the tax, and a sliding tax credit is applied to tenants with annual or annualized rents between $250,000 and $300,000. For those tenants who are subject to the tax and whose annual or annualized rent is over $300,000, the effective tax rate is 3.9 percent of gross rent.
Annual CRT collections depend on the tax rate, rent levels, and the amount of rental space subject to the tax. Unlike the transfer taxes, CRT revenues are not subject to significant year-to-year fluctuations. Since the last rate reduction in 1999, CRT receipts have grown each year. IBO projects that CRT revenue will grow faster than average rents in 2015 but more slowly thereafter. This implies that there will be an increase in the amount of space subject to the tax in 2016 as new office buildings rent up, followed by a slight decline over the following three years. These results are consistent with IBO’s expectation that more small firms will be seeking space in Manhattan, and more leasing activity will be occurring in areas exempt from the tax.
IBO’s CRT forecast for 2015 is $24 million higher than OMB’s, a 3.3 percent difference. The difference between the forecasts diminishes in each of the next two years, and for 2018 IBO’s forecast is below OMB’s, by $17 million (2.1 percent).
Personal Income Tax. In contrast to most of New York City’s other major sources of tax revenue, net revenue (gross collections minus refunds) from the personal income tax (PIT) is expected to barely increase in 2015. IBO forecasts $9.6 billion of PIT revenue this year, just $77 million (0.8 percent) more than 2014 receipts. This lack of revenue growth is mostly the result of an anticipated large decline in state/city offsets—an accounting adjustment that reconciles cash flows between the city and the state, which administers collections of the city PIT—rather than declines in the income and/or employment of city residents. Without this decline in offset payments from the state to the city, IBO projects that PIT revenue would have grown 3.5 percent in 2015. Faster personal income growth forecast for calendar years 2014 and 2015 is expected to increase withholding collections and quarterly estimated payments in this fiscal year and, to a greater extent, in fiscal year 2016. IBO forecasts a 6.1 percent increase in PIT revenue for 2016. After 2016, we expect PIT revenue growth to moderate in line with our forecast of slower income and employment growth.
Withholding payments—the single largest component of PIT receipts—are projected to increase by a modest 2.7 percent this year. To date in 2015 (from July through November), withholding receipts are up 8.3 percent over the same period last year, but this growth is not expected to continue through the remainder of the year. Based on our expectation that securities industry profits (we use as a proxy the broker-dealer profits of New York Stock Exchange member firms) will fall 11.0 percent in calendar year 2014, IBO currently anticipates a decline in year-end bonus compensation, reducing withholding payments during the all-important December through March bonus season. However, some Wall Street observers expect a considerable increase in bonus payments to employees who exercise deferred compensation options granted to them in prior years. The extent of bonuses being realized from previous years is unknown at this point, but if it proves substantial, the effect will become evident in withholding in the coming months, and could warrant an increase in our estimate of withholding in 2015.
Although we are projecting only modest growth in withholding this year, IBO expects the resumption of estimated payments growth—to 5.1 percent—to bolster PIT growth this year. Estimated payments are made by taxpayers who are self-employed or anticipate realizing capital gains from the sale of financial and property assets, along with those filing for extensions to delay the deadline for final returns past April 15th. Estimated payments fell by 7.4 percent in 2014 because many taxpayers choose to speed up realization of capital gains to take them in calendar year 2012 rather than later in anticipation of federal tax hikes that took effect in January 2013—a shift in the timing of realizations that boosted fiscal year 2013 revenue at the expense of 2014 and, to a lesser extent, 2015 revenue. Despite the renewed growth in estimated payments revenue this year, the total is expected to remain below the revenue collected in 2013.
IBO forecasts that personal income tax revenues in 2016 will reach $10.2 billion—6.1 percent higher than we project for 2015. Strong employment growth in calendar years 2015 and 2016 (annual average gain of 77,200 jobs) is expected to accelerate withholding growth to 5.5 percent and estimated payments are expected to increase by 8.6 percent. We also project an increase in payments with final returns, but this will be more than entirely offset by an anticipated increase in refunds.With IBO expecting personal income growth to peak at the end of calendar year 2015 and start falling steadily by the middle of 2016, we project PIT growth will slow to an annual average rate of 3.6 percent in 2017 and 2018. PIT revenue is forecast to reach $10.9 billion by 2018, 25.2 percent higher than the previous revenue peak in 2008.
IBO projects faster city income and employment growth than OMB during the forecast period, particularly in calendar years 2014 and 2015. As a result IBO’s personal income tax forecast exceeds OMB’s each year through 2018, with the difference between the two forecasts growing over time. For the current year, our forecast is $209 million (2.2 percent) above OMB’s and for 2016 the difference rises to $452 million (4.6 percent). Combined 2017 and 2018 revenue is 5.6 percent higher in the IBO forecast than in OMB’s.
Business Income Taxes. Combined revenue from the city’s three business income taxes barely increased in 2014—by only 0.3 percent. For 2015, IBO forecasts much stronger revenue growth—5.2 percent—resulting in business tax revenue greater than $6 billion for the first time since 2007. Revenue growth is expected to accelerate in 2016, increasing by 8.4 percent, and then slow to around 6.3 percent annually in the subsequent years.
The three taxes are expected to have markedly different trajectories over the 2015 through 2018 period. In 2015, IBO projects collections of the general corporation tax (GCT) and the unincorporated business tax (UBT) to exceed 2014 revenues by 9.1 percent and 7.5 percent, respectively. Banking corporation tax (BCT) revenue, however, is forecast to decline by 6.9 percent this year. Beginning in 2016, IBO expects growth from all three taxes for the remaining years of the financial plan period.
IBO’s general corporation tax forecast is $3.0 billion for 2015—9.1 percent ($251 million) greater than revenue in 2014. Through October, GCT collections for 2015 are up $46 million (8.8 percent) over the same period last year. Data on current-year payments from large taxpayers (those with payments of $1 million or more) indicate that much of the growth so far has come from firms in information (up 69 percent), retail and wholesale trade (up 76 percent), and real estate (up 187 percent). These sectors are also expected to spur GCT revenue growth in 2016. In contrast, collections from finance and insurance firms and professional and business service firms increased only modestly. Even if securities industry profits in calendar year 2014 drop to $14.9 million as IBO projects, Wall Street firms remain an outsized source of GCT revenue. But they are expected to contribute only moderately to growth in GCT collections over the next few years. Wall Street profits are expected to grow by 6.2 percent annually in calendar years 2015 and 2016, and then slow to an average of 3.8 percent annually in the later years as rising interest rates and increasing compensation expenses portend lower profit margins. For 2017 and 2018, IBO projects that GCT collections will grow at an average annual rate of 5.8 percent.
UBT revenue is projected to grow at an annual average rate of 8.7 percent from 2014 through 2018, a faster pace than that of the other two business taxes over the entire forecast period. Continued expansion of the professional and business services industry, which is projected to add 69,000 jobs (10.5 percent growth) in the next four years, is expected to fuel the increase in collections. For 2015, IBO forecasts $2.0 billion in UBT revenue—$142 million (7.6 percent) greater than in 2014—which would bring UBT collections to an all-time peak. September and October collections are up $28.5 million (7.4 percent), compared with the same period last year, and similar growth is expected for the rest of the year. With both the local and national economies forecast to continue expanding in calendar year 2015, IBO anticipates even faster UBT revenue growth next year and beyond: 11.3 percent in 2016 and an average annual rate of 7.9 percent in 2017 and 2018, when UBT revenue is expected to reach $2.6 billion.
The banking corporation tax (BCT) is the city’s most volatile major source of revenue, with strong revenue growth in one year often followed by a steep decline the following year. The bank tax’s volatility is primarily due to very large fluctuations in refunds resulting from overpayments of estimated liabilities made throughout the fiscal year—overpayments often affected by the timing of deductions for net operating losses. Through October, BCT receipts for the current fiscal year are $45 million (5.1 percent) less than during the same period last year, a revenue decline offsetting about two-thirds of the combined growth of GCT and UBT revenue so far this year. For 2015 as a whole, IBO forecasts a 6.9 percent decrease in BCT collections to $1.1 billion, and then a rebound to $1.2 billion in 2016, an increase of 8.2 percent. Following the sharp rise in 2016 collections, IBO expects BCT growth in 2017 and 2018 to average a more moderate 4.6 percent a year.
There are several reasons to expect BCT revenue growth to slow in the coming years. Rising interest rates will increase the cost of obtaining funds and thereby take a toll on bank profits. Many of the recent settlements between large banks and the U.S. government over practices leading up to the 2008 financial crisis include payments by the banks. To the extent these payments are tax deductible, they lower banks’ taxable income, thereby shrinking BCT collections. Instituting Dodd-Frank regulations, including the adopted Volcker Rule, is also expected to take a toll on BCT collections by limiting some activities by banks, including highly lucrative (but potentially risky) proprietary trading.
IBO’s revenue forecast for the combined business income tax revenue is $193 million (3.2 percent) higher than OMB’s in the current year—$117 million higher for GCT, $16 million higher for BCT and $60 million higher for UBT. For 2016, IBO’s forecast is a total of $556 million above OMB’s—$265 million higher for GCT, $238 million higher for UBT, and $53 million higher BCT. The difference between the two forecasts grows each year and reaches $1.0 billion in 2018, reflecting IBO’s forecast of faster employment and productivity growth.
General Sales Tax. Following two years of strong growth in sales tax collections (5.5 percent in 2013 and 5.9 percent in 2014), IBO expects somewhat slower growth of 3.4 percent in 2015 with revenue anticipated to be $6.7 billion. So far in 2015 (through October), the increase in collections has been moderate—4.1 percent over the same period last year and somewhat slower growth is forecast for the remainder of the year as local personal income growth continues to slow from the strong first quarter of calendar year 2014. A more robust expansion of the national economy and strong U.S. personal income growth in calendar years 2015 and 2016 are reflected in our forecast of a 4.4 percent increase in sales tax revenue for 2016 when collections are expected to reach $7.0 billion.
The projected growth in sales tax revenue is related to growth in local income, which is expected to increase by 5.8 percent in calendar year 2015 and 6.1 percent in 2016. However, revenue growth will not be proportional to income growth because increases in income are expected to be concentrated in high-income households, which generally spend a smaller share of their income than do households with lower incomes.
Income and employment growth in recent years has allowed households in New York City to address pent-up demand for goods and services that resulted from the recession of 2008-2009. The resulting purchases have bolstered sales tax collections in recent years but as needs are addressed, less pent-up demand remains, which contributes to the slowdown in sales tax revenue growth expected in the forecast period.
Continued increases in the number of visitors to the city—surpassing most expectations—has contributed considerably to sales tax growth in recent years. Although we expect international tourism to weaken in the near term, domestic tourism is projected to grow stronger. Recent sales tax collections have also been boosted by the decline in gasoline prices and other energy costs, which have left consumers with more income available for other goods and services. Although the potential of lower gas prices to spur other purchases is muted in New York City because city residents are less reliant on motor vehicles, IBO expects the fall in gas prices to spur travel to the city.
Consumers’ increasing reliance on Internet purchases—abetted by the use of mobile devices and tablets, which by one measure accounted for 1 in 4 online purchases this past Black Friday—will continue to limit the growth of sales tax collections. Initial data on 2014 holiday sales indicate increasing online purchases and decreasing in-store purchases in comparison to last year. Although Internet retailers that have nexus—some physical presence—are required to collect New York State and New York City sales taxes on taxable goods and services, some vendors do not have nexus in New York City and, therefore, do not collect the city’s sales tax.
IBO projects annual average sales tax growth of 4.0 percent during 2017 and 2018 with revenue increasing to $7.6 billion in 2018—more moderate growth than in 2016 because of slower economic growth nationally.
IBO’s sales tax forecast is approximately the same as OMB’s in the current year and $64 million (0.9 percent) higher in 2016. Differences in the two forecasts remain low throughout the forecast period.
Hotel Occupancy Tax. IBO forecasts $549 million in hotel tax revenue in 2015, an increase of 2.4 percent over 2014 collections. This growth rate is much lower than the growth seen in 2014 (6.2 percent) and in any year since the 2008-2009 recession. Economic troubles in Europe, China, Russia, Brazil, and other countries are likely to slow growth in tourism from these areas in the near term, which will have more of an impact on hotels than would similar changes in the number of domestic visitors, since international travelers tend to spend more and stay longer than their domestic counterparts.
For fiscal year 2016, faster growth in U.S. output and big gains in U.S. personal income, coupled with lower gasoline prices and a resumption of economic growth in Europe, is forecast to make up for weakness in the current year and growth is expected to accelerate to 8.5 percent as hotel tax revenues reach $596 million. The relative strength in demand for hotel rooms is expected to continue for the remainder of the forecast period—with somewhat slower revenue growth of 5.2 percent (to $626 million) in 2017 and 4.9 percent (to $657 million) in 2018.
IBO’s hotel tax forecast is approximately the same as OMB’s in the current year. For 2016, IBO’s revenue projection is $40 million (7.1 percent) higher than OMB’s, due to IBO’s forecast of faster growth in output and U.S. personal income early in the forecast period. The difference grows each year thereafter, reaching $62 million in 2018.
Other Revenues. The city’s nontax revenues combine a variety of fees, fines, charges, asset sales, interest income, and other miscellaneous revenue, which total $6.6 billion this year. The Mayor’s November financial plan anticipates that nontax revenues will fall to $5.9 billion next year, a decline of $629 million. One reason for the drop is that the 2015 total includes a one-time $1 billion transfer from the Health Insurance Stabilization fund, which was a product of the agreement between the city and the Municipal Labor Committee on ways to help fund the current round of collective bargaining agreements. The difference between 2015 and 2016 would have been even greater without the shift of over $500 million in revenue that had been anticipated from the sale of taxi medallions during 2015. The November plan shifts the realization of that revenue to later years. IBO’s revenue estimate includes additional reductions in revenue forecast from these sales due to recent declines in market prices for medallions.
State, federal, and other categorical aid and interfund revenue are the remaining sources among nontax revenues. They are expected to total $21.7 billion this year, which includes $908 billion in anticipated Hurricane Sandy assistance from the federal government. The bulk of that money has been allocated through the federal government’s Community Development Block Grant process to help in the recovery and is scheduled to be spent this year, which largely accounts for the decline in this revenue category to $21.2 billion in 2016. After 2016, state, federal, other categorical and interfund revenues resume growing at a slower pace; annual growth is expected to average 2.1 percent in 2017 and 2018. By the last year of the financial plan, these grants are expected to total $22.1 billion.
Spending
While IBO’s tax revenue projections exceed those of the de Blasio Administration by increasingly substantial sums—the differences grow from more than $600 million this year, to $1.3 billion in 2016, to $2.3 billion in 2018—our differences in spending projections are much more modest. For the current year, we project city-funded spending will be $29 million less than estimated by the Mayor. For 2016 and beyond, IBO’s forecast of city-funded spending exceeds the Mayor’s, with the difference rising to $266 million in 2018.
|
Pricing Differences Between IBO and the de Blasio Administration
Items that Affect the Gap
Dollars in millions |
||||
|
|
2015 |
2016 |
2017 |
2018 |
|
Gaps as Estimated by the Mayor |
$- |
$(1,835) |
$(1,190) |
$(1,771) |
|
Revenue |
|
|
|
|
|
Taxes |
|
|
|
|
|
Property |
$90
|
$105
|
$248
|
$474
|
|
Personal Income |
209
|
452
|
570
|
581
|
|
General Sales |
34
|
64
|
34
|
24
|
|
General Corporation |
117
|
265
|
374
|
470
|
|
Unincorporated Business |
61
|
238
|
363
|
458
|
|
Banking Corporation |
16
|
53
|
93
|
127
|
|
Real Property Transfer |
44
|
28
|
42
|
46
|
|
Mortgage Recording |
19
|
30
|
38
|
47
|
|
Utility |
5
|
14
|
22
|
27
|
|
Hotel Occupancy |
2
|
40
|
53
|
62
|
|
Commercial Rent |
24
|
17
|
5
|
(17) |
|
Cigarette |
-
|
(1) |
(2) |
(3) |
|
Subtotal |
$621
|
$1,304
|
$1,839
|
$2,296
|
|
STaR Reimbursement |
$(6) |
$(29) |
$(26) |
$(19) |
|
Taxi Medallion Sales |
(5) |
(31) |
(24) |
(26) |
|
Total Revenue |
$610
|
$1,245
|
$1,789
|
$2,251
|
|
Expenditures |
|
|
|
|
|
Debt Service |
$221
|
$75
|
$75
|
$75
|
|
Fringe Benefits: |
|
|
|
|
|
Health Insurance–Education |
(8) |
(26) |
(21) |
(36) |
|
Health Insurance–City University |
(6) |
(9) |
(17) |
(29) |
|
Health Insurance–All Other Agencies |
(21) |
(17) |
36
|
29
|
|
Education |
(125) |
(139) |
(154) |
(167) |
|
Police |
(25) |
(25) |
(25) |
(25) |
|
Board of Elections |
-
|
(25) |
(25) |
(25) |
|
Correction |
-
|
(15) |
(15) |
(15) |
|
Homeless Services |
(10) |
(40) |
(22) |
(22) |
|
Public Assistance |
(6) |
(7) |
(7) |
(7) |
|
Small Business Services |
9
|
(4) |
(4) |
(4) |
|
Campaign Finance Board |
-
|
-
|
-
|
(40) |
|
Total Expenditures |
$29
|
$(232) |
$(179) |
$(266) |
|
Total IBO Pricing Differences |
$639
|
$1,013
|
$1,610
|
$1,985
|
|
IBO Prepayment Adjustment 2015/2016 |
(639) |
639
|
-
|
-
|
|
IBO Surplus/(Gap) Projections |
$- |
$(184) |
$420
|
$214
|
|
NOTES: Negative pricing differences (in parentheses) widen the
gaps, while positive pricing differences narrow the gaps.
Figures may not add due to rounding.
New York City Independent Budget Office
|
||||
Under the terms of Mayor de Blasio’s financial plan for 2015 through 2018, IBO estimates that total city spending—including state and federal aid and adjusting for the use of last year’s surplus to prepay some of this year’s expenses —will grow from $78.9 billion this year to just under $80.0 billion next year, and reach $84.3 billion by 2018, an average annual increase of 2.3 percent. Looking just at city-funded expenditures and once again adjusting for the use of last year’s surplus, IBO expects spending will rise from $57.1 billion this year to $62.2 billion in 2018, an average growth rate of 2.9 percent.
IBO Expenditure Projections
Dollars in millions
2015
2016
2017
2018
Average Change
Health & Social Services
Social Services
Medicaid
$6,633
$6,602
$6,604
$6,604
-0.1%
All Other Social Services
3,186
3,082
3,087
3,075
-1.2%
HHC
202
150
193
208
0.9%
Health
1,450
1,427
1,431
1,433
-0.4%
Children Services
2,841
2,845
2,856
2,858
0.2%
Homeless
1,106
1,109
1,049
1,050
-1.7%
Other Related Services
717
550
551
551
-8.4%
Subtotal
$16,135
$15,764
$15,772
$15,780
-0.7%
Education
DOE (excluding labor reserve)
$20,823
$21,584
$22,399
$23,306
3.8%
CUNY
902
873
881
888
-0.5%
Subtotal
$21,726
$22,458
$23,280
$24,194
3.7%
Uniformed Services
Police
$4,820
$4,713
$4,709
$4,711
-0.8%
Fire
1,934
1,897
1,880
1,843
-1.6%
Correction
1,121
1,131
1,129
1,130
0.3%
Sanitation
1,490
1,540
1,521
1,521
0.7%
Subtotal
$9,366
$9,282
$9,239
$9,205
-0.6%
All Other Agencies
$9,673
$8,759
$8,878
$9,065
-2.1%
Other Expenditures
Fringe Benefits
$4,986
$5,280
$5,549
$5,951
6.1%**
Debt Service
4,975
6,018
7,196
7,471
6.5%*
Pensions
8,461
8,499
8,362
8,664
0.8%
Judgments and Claims
712
710
746
782
3.2%
General Reserve
750
750
750
750
n/a
Labor Reserve:
Education
11
-
-
-
n/a
All Other Agencies
678
1,311
1,059
1,944
n/a
Expenditure Adjustments
-
80
176
312
n/a
TOTAL EXPENDITURES
$77,473
$78,910
$81,009
$84,117
2.8%
NOTES: *Represents the annual average change after IBO repricing
and prepayment adjustments.
**Fringe benefits exclude DOE and CUNY expenditures, which are
reported within DOE and CUNY budget amounts.
Expenditure adjustments include energy, lease and non-labor
inflation adjustments. Figures may not add due to rounding.
New York City Independent Budget Office
Federal Aid Drives Spending Growth. A considerable portion of the growth in total city spending in the financial plan results from the recognition of federal aid for Hurricane Sandy recovery. The November plan includes $908 million more in Sandy-related federal aid for 2015 than was included in the budget adopted in June. The original plan had included $25 million in federal Community Development Block Grant Disaster Relief funds for 2015. The budget now anticipates the city will spend $811 million in disaster relief aid this year. Much of the funding added to the 2015 budget is rolled over from unspent disaster relief funds in the 2014 plan. More than $490 million of the planned 2015 disaster relief spending is targeted for the Build It Back housing recovery program.
The de Blasio Administration has also substantially increased expected disaster relief spending in the succeeding years of the financial plan. In 2016, the Mayor now expects the city to spend $122 million, up from $6.6 million in the plan adopted in June. Similar increases are projected for 2017 and 2018. A large share of these expenditures is also targeted for the Build It Back program. In 2016, for example, $67 million, or 55 percent of disaster relief spending, is planned for the housing recovery effort.
The de Blasio Administration has also increased its expected spending of Federal Emergency Management Agency aid in 2015. The adopted budget had allocated just over $5 million for 2015. The new plan budgets an increase of nearly $72 million for a total of about $77 million. These funds will be used for purposes such as replacing and repairing Sandy-damaged public buildings, roads, and equipment. There are few federal emergency agency dollars budgeted beyond this year.
New City-Funded Spending. The new financial plan includes a moderate amount of new city-funded programmatic spending, a total of about $237 million this year in so-called “new needs,” $207 million next year, and similar amounts in 2017 and 2018. These funds are targeted to a variety of programs, including the retraining of police officers, improvements in mental health screening and discharge planning in the city’s jails, and the effort to retrofit public and private buildings to enhance energy efficiency.
Jails and Mental Health. Shortly after the release of the November financial plan, Mayor de Blasio announced plans to expand mental health and discharge planning services in the city’s jails. The share of inmates in Rikers Island with mental illness has grown to 40 percent and many of these inmates cycle in and out of the jail system. The plan is based on recommendations from the Mayor’s Task Force on Behavioral Health and Criminal Justice and has a price tag of about $130 million over the 2015-2018 financial plan period.
The Mayor’s November plan already included $93 million in new funding for 2015 through 2018 in anticipation of the proposal. The remainder of the funding is expected to come from the District Attorneys’ asset forfeiture accounts. Of the three largest components of the plan, nearly $38 million will be used to expand discharge planning services, $36 million to double the ratio of correction officers to inmates in adolescent facilities, and about $11 million to retrain correction officers and pair them with mental health staff in an effort to lessen the use of force during confrontations with inmates.
Police Training and Deployment. A separate effort to ease confrontations and reduce the use of force focused on police officers. The budget includes $29 million in 2015 for enhanced on the job-training for roughly 22,000 officers. The training will be on overtime. The November plan also includes funding for an overtime initiative that has already occurred, Operation Summer All Out. The budget provides $14 million to cover the cost of this summer’s deployment of roughly 300 officers to foot patrols in Brooklyn and Bronx precincts that experienced spikes in gun violence.
Rising Homeless Shelter Costs. The rising number of homeless in the city’s shelter system and a failed effort to reduce family shelter costs has led the de Blasio Administration to increase the budget for sheltering homeless families. For the current fiscal year, the Mayor added $105 million to the budget ($41 million in city funds, the remainder state and federal) for running family shelters. This brings total family shelter spending in 2015 to a record high $574 million. The financial plan also includes $45 million more each year ($14 million in city funds) than previously budgeted for family shelter in fiscal years 2016 through 2018.
A majority of the funds was added to cover the failure of a plan to save $60 million ($19 million in city funds) in family shelter costs by reducing payments to hotel and cluster site shelter providers. The contractors agreed to only $4.4 million in savings. The savings were supposed to help fund the new rental subsidy program for homeless families known as LINC II.
The de Blasio Administration has also added nearly $12 million in city funds to the budget for adult shelters in 2015 due to a reestimate of needed capacity. The budget for running the adult shelters this year is now $356 million. No new funds were added for subsequent years.
In addition to the growth in expenditures on shelter costs, the budget includes increased spending on measures to prevent homelessness and to provide subsidies to help families leave shelters. A program to assist low-income households with one-time rent arrears has been increased by nearly $16 million this year. Funding for legal services to help tenants in housing court has been provided additional city funds, $2.3 million this year and $3.0 million a year in 2016 through 2018.
The Mayor has also newly funded a rental subsidy program for victims of domestic violence who are now residing in city shelters. The program will subsidize 1,900 households this year—no increase in the number of families is expected in future years. The so-called LINC III rental assistance program has $9 million in funding for this year and grows to $26 million next year.
Education. Under the November plan total Department of Education spending will grow by about $7 million since the budget was adopted and reach $20.7 billion. A combination of new needs and technical adjustments related to recently signed labor contracts increases the city-funded portion of the education department budget by $64 million. Shifts of city funds from other agencies, including nearly $11 million from the Department of Environmental Protection for retrofitting toilets, adds about $22 million to the education budget. These increases are partially offset by a $52 million decline in federal aid and a $5.5 million drop in state aid.
With these changes, the city-funded portion of the Department of Education budget will reach nearly $9.7 billion this year, roughly 47 percent of the agency’s spending. The financial plan anticipates city funding for education will grow to $10.0 billion next year with the education department’s total budget reaching $21.5 billion.
Built to Last. The financial plan also includes funding for the de Blasio Administration’s sustainability initiative called One City, Built to Last, which was first announced in September. The plan represents the city’s commitment to an 80 percent reduction in greenhouse gas emissions from their 2005 level by 2050. The multiagency plan includes $24 million in funding for this year and $40 million for 2016 to improve energy efficiency in public and privately owned buildings.
Projections of Higher Spending. IBO estimates that expenditures will be higher than projected by the de Blasio Administration, with some of our higher projections coming in areas already slated for spending increases in the November plan. The largest single difference in estimates is in the education department. IBO expects that city-funded spending by the Department of Education will be $125 million higher than budgeted this year and grow to $167 million of additional spending by 2018. The increased spending is driven by IBO’s estimates for charter school expansion that has already been approved but not fully recognized in the budget plan and our assumption that Medicaid reimbursements for certain special education services will continue to fall below expectations.
IBO estimates that spending on charter schools will be nearly $79 million above the level currently budgeted for this year, $93 million next year, and $121 million by 2018. We estimate that Medicaid reimbursements will be $46 million below expectations for each of the years covered by the financial plan.
Despite the additional funds included in the November plan for homeless shelter operations, we expect more city funds will be needed. Based on growth seen in recent years, IBO estimates that the adult homeless shelter system will exceed its budgeted capacity this year and require $10 million in additional city funds and $22 million annually in 2016 through 2018. Likewise, the de Blasio Administration has not sufficiently funded family shelters based on the number of families expected to be in the system. We estimate that spending in 2016 for family shelter will be $62 million ($18 million in city funds) above the $511 million currently budgeted.
Among the other functions we estimate will require additional city funding is overtime for police and correction officers. IBO projects that overtime spending will be a combined $40 million higher annually than currently budgeted for 2016 through 2018.
Budget Savings. Much like the Bloomberg Administration’s final November financial plan in 2013, Mayor de Blasio’s November plan does not contain a Program to Eliminate the Gap, or PEG program. In fact, there was no PEG program throughout fiscal year 2014. The de Blasio Administration has said it is moving away from the PEG process and developing a more collaborative approach between City Hall and Mayoral agencies to identify savings measures that would not diminish services. The Mayor’s office has also indicated that when agencies ask for additional funds the requests are expected to be accompanied by proposals for an equal amount of savings.
Despite the absence of a formal PEG program, the financial plan includes some substantial savings. The largest amount comes through a reduction in debt service, including savings from a complex interplay between the refinancing of Sales Tax Asset Receivable Corporation debt and the city’s Transitional Finance Authority. The windfall from refinancing the sales tax corporation debt is being set aside to pay off Transitional Finance Authority bonds that come due during fiscal years 2015 through 2018. The savings will total $650 million over this period: $16 million this year, $234 million next year, and about $200 million annually in 2017 and 2018.
The financial plan includes additional debt service savings as well. Taking advantage of continued low interest rates, the city refinanced $900 million in general obligation bonds, saving a total of $133 million over four years, $106 million of it in 2016. The de Blasio Administration also recognized $75 million in savings in 2015 by eliminating the money set aside for debt service in case the city needed to issue short-term debt.
IBO’s expenditure projections anticipate additional debt-service savings on top of what is included in the financial plan. Although interest rates remain at historic lows, the city continues to budget for variable rate debt with the assumption of much higher rates. The Mayor’s budget office assumes the city will pay 4.1 percent interest on tax-exempt variable rate debt and 6.0 on taxable variable rate debt this year. But interest rates have been much the same this year as last year, less than 1.0 percent on taxable and nontaxable variable rate bonds. We project the city will save an additional $221 million in debt service this year because of the lower-than-budgeted interest rates. Given the city’s current fiscal outlook we also assume there will be no need for the city to borrow short term, saving another $75 million a year in 2016 through 2018.
Out of the Red, Into the Black
Based on IBO’s revenue and spending projections, New York City’s fiscal outlook remains positive. Unless national or international events derail the local economy in the coming weeks or the city undertakes big, new initiatives that would boost spending or cut taxes, bringing the 2016 budget into balance should not be a heavy lift. The 2016 budget plan contains a general reserve of $750 million—funds not yet allocated for a specific purpose within the budget—four times the shortfall IBO projects for next year.
Still, spending needs could erode the city’s fiscal condition. Labor settlements with the uniformed services that still have expired contracts may prove more costly than anticipated in the budget plan. Soon after releasing the November financial plan, the Mayor announced a tentative settlement with a coalition representing high ranking uniformed officers in the police, fire, sanitation, and correction departments. This pact deviated from the pattern agreed to by the teachers and other unions that had come to terms with the city, and if extended to all the uniformed unions would cost about $460 million more than currently budgeted for labor settlement increases in 2015 through 2018 based on IBO’s preliminary estimate.
Ongoing budget problems at
the public hospitals corporation and public housing authority could also
lead to additional spending by the city. In the past year the city has
helped both these agencies by waiving hundreds of millions of dollars in
reimbursements. If the two agencies, which serve many of the city’s
poorest residents, continue to struggle, pressure for further budget
assistance may follow.
But it is the city’s relatively strong fiscal outlook that could itself
prove to be the financial plan’s greatest risk. The plan contains
general reserves of $750 million a year and $1.8 billion remains in the
Retiree Health Benefits Trust. With the city facing only a modest budget
shortfall next year and surpluses in the following years under IBO’s
projections, it may be difficult to contain the impulse to expand
current services and implement new, ongoing programs or cut taxes.
Balancing these aspirations within the limits of the city’s resources is
the key to keeping the budget out of the red and in the black.
Endnotes
1These
midrange industries are construction, manufacturing, wholesale trade,
transportation and utilities, rental and leasing, administrative and
support services, education, health care services (excluding social
assistance), and government.
2For
additional information about the city’s real property tax, see
Twenty-Five Years After S7000A: How
Property Tax Burdens Have Shifted in New York City, Independent
Budget Office for New York City, December 2006. When IBO refers to
market values and assessments, the reference includes only taxable
property. The assessed value for tax purposes (also referred to as
billable taxable value) reflects the required phase-in of assessment
changes for apartment, commercial, and industrial buildings. In this
report the billable taxable values are shown before applying the STAR
exemptions.
3The
Department of Finance is responsible for finalizing the assessment roll,
while the actual property tax levy is determined by the City Council
when it sets the tax rates for each class. IBO’s baseline property tax
revenue forecast and the de Blasio Administration’s forecast both assume
that the average tax rate during the forecast period will remain at
12.28 percent, the rate set by the City Council in December 2008 when
the Council enacted then-Mayor Bloomberg’s proposal to rescind a
short-lived 7 percent rate reduction.
PDF version available here.
Receive notification of free reports by e-mail Facebook Twitter RSS