
June 2013
Examining the City’s Response to Medical Emergencies 1999-2011:
With More Ambulances on the Streets Response Times to Serious Medical Emergencies Improve
PDF version available here.
Summary
While questions about the city’s timely response to medical emergencies has been a subject of considerable public interest in recent weeks, it is a topic that policymakers have grappled with for many years. In 1996, the Giuliani Administration shifted responsibility for running the city’s Emergency Medical Services ambulances from the public hospital system to the fire department. This was done to better coordinate ambulance and firefighter responses to medical emergencies as well as to reduce redundant staffing in the agencies.
When the fire department took over operation of the city’s ambulances and the dispatching of both public and private ambulances, a goal was set of responding to 90 percent of serious medical emergencies with an Advanced Life Support ambulance staffed with paramedics in 10 minutes or less. To review the city’s progress in achieving that goal, IBO has obtained data from the fire department on the response to each medical emergency in the city reported to 911 from 1999 through 2011 (a period that predates the new dispatch system). In this report, we review what these data show about trends in the delivery of emergency medical services in New York City. Among our findings:
• There has been a significant increase in the average daily number of fire department and private ambulances deployed on city streets. There was a combined average of 976 eight-hour ambulance work shifts or tours in 2011, an increase of 242 tours (33 percent) since 1999.
• The greater number of ambulances has been accompanied by swifter responses to medical emergencies. The share of serious medical emergencies responded to within 10 minutes by paramedics increased from 64 percent in 1999 to 81 percent in 2011.
• Disparities in response times among the five boroughs also narrowed. For example, in the Bronx in 1999 only 54 percent of serious medical emergencies had an ambulance staffed by paramedics arrive in 10 minutes compared with 71 percent in Manhattan, a difference of 17 percentage points. In 2011, the share of responses by paramedics within 10 minutes had increased to 80 percent in the Bronx and 83 percent in Manhattan—a difference of just 3 percentage points.
In addition to improved response times, there are far fewer instances in which no paramedics arrive at the scene of a serious medical emergency, leaving management of the emergency to emergency medical technicians whose training enables fewer medical procedures. In 1999, paramedics failed to arrive for serious emergencies 29,000 times. By 2011, the number of serious emergencies for which paramedics never arrived had fallen to 5,150. The greatest improvement was in the Bronx, where the share of serious emergencies without paramedics fell from 11 percent in 1999 to 2 percent in 2011
.Background
In March of 1996, responsibility for operation of the city’s own ambulance system, known as Emergency Medical Services (EMS), passed from the Health and Hospitals Corporation (HHC) to the fire department (FDNY). Among the anticipated benefits of the FDNY takeover of EMS were better coordination between ambulances and the increasing number of firefighter units responding to medical emergencies, as well as a consolidation of redundant supervisory, administrative, and support units.
A System of City and Private Ambulances.
Emergency medical personnel responding to medical emergencies reported through the 911 system are deployed either in city or private ambulances. City ambulances are operated and staffed by the fire department, while private ambulances participating in the 911 system are operated directly by private hospitals or by commercial ambulance companies operating under contract with private hospitals.1 Private ambulances, often referred to as voluntary ambulances, can participate in the 911 system only after the fire department has authorized them to do so and has assigned them areas of the city to cover. The hospitals are not paid by the city for operating 911-dispatched ambulances. While they charge fees for transporting patients, the fee revenue often does not cover the hospitals’ costs of staffing and operating the ambulances. For the hospitals, the financial benefits of providing ambulance services primarily flow from the patients who are brought to their emergency rooms and/or admitted to their hospitals—patients who otherwise might have been taken to other hospitals, including those run by HHC.2The decision to assign either a FDNY or private ambulance is made by FDNY dispatchers and is based on the availability of the nearest appropriate city or private ambulance at the time. In 2011, the fire department directly operated almost two-thirds (63 percent) of all ambulance tours (eight- hour shifts), with the remaining 37 percent provided by private ambulances. Regardless of whether it is an EMS or voluntary ambulance, city protocol generally calls for patients to be brought to the closest emergency room appropriate for their medical condition, whether it is at a HHC facility or a private hospital.3
Categorizing Medical Emergencies.
Medical emergency calls received by the 911 system are categorized according to perceived seriousness, with a basic distinction being Advanced Life Support (ALS) incidents versus generally less serious Basic Life Support (BLS) incidents.4 There were just over 325,000 ALS incidents in 2011, or about one-quarter of all medical emergencies.5 They included cardiac conditions, difficulty in breathing, unconsciousness, major burn cases, and other serious medical emergencies. The remaining three-quarters of reported medical emergencies were designated as BLS incidents, and included a wide range of conditions such as noncritical injuries, conditions involving emotionally disturbed patients, patients with abdominal pain or other sickness, and drug and alcohol abuse cases.The level of response to a given medical emergency is determined by its seriousness. Advanced Life Support ambulance units, which respond to the most serious emergencies, are required to be staffed with two paramedics in New York City. Elsewhere in the state, an ALS ambulance can be staffed with one paramedic and one emergency medical technician (EMT).6 In contrast, Basic Life Support ambulances that primarily respond to less serious incidents are staffed with two EMTs. For certain emergencies, such as cardiac arrest and choking cases, ALS and BLS ambulances are both sent to respond. Some incidents that are initially categorized as only requiring a Basic Life Support ambulance staffed by EMTs are instead later found to require the skills of a paramedic. In these cases an Advanced Life Support ambulance, if available, is then dispatched.
All ambulance personnel dispatched to medical emergencies, whether deployed in city or private ambulances, are New York State certified either as paramedics or emergency medical technicians. Paramedics are more highly trained than EMTs; paramedics receive some 1,500 hours of training, compared with 120 hours to 150 hours for EMTs. Paramedics’ higher level of training allows them to perform a range of advanced medical procedures, including inserting breathing tubes as well as injecting or otherwise administering drugs. On average, paramedics deployed in FDNY ambulances cost the city about $22,000 more per year than EMTs. Average compensation (including salary and all fringe benefits) for paramedics totals about $92,000 per year; the average for EMTs is about $70,000.
Firefighter Response to Medical Emergencies.
Ambulance response to medical emergencies deemed life threatening is now frequently supplemented by dispatch of a firefighting company. All FDNY engine companies are now CFR-D qualified, signifying that at least some of the firefighters onboard are trained in both cardiopulmonary resuscitation and defibrillation, the latter often a critical step in reviving heart attack victims. However, firefighters are in general not as highly trained in emergency medical procedures as EMTs or paramedics, and an ambulance is sent to medical emergencies regardless of whether firefighters also respond.|
Steep
Increase in Dispatching Firefighters To Medical
Emergencies |
||||
|
|
1993 |
1999 |
2005 |
2011 |
|
Fires
|
|
|
|
|
|
Structural |
30,481 |
29,429 |
28,455 |
25,380 |
|
Nonstructural |
63,305 |
32,083 |
22,940 |
15,729 |
|
Subtotal
(All Fires) |
93,786 |
61,512 |
51,395 |
41,109 |
|
Medical Emergencies |
1,971 |
156,573 |
202,526 |
216,083 |
|
Other Emergencies
and False Alarms |
266,818 |
230,946 |
231,781 |
230,825 |
|
TOTAL Incidents |
362,575 |
449,031 |
485,702 |
488,017 |
|
SOURCE: New York
City Fire Department
NOTES: Structural fires occur in buildings and other
structures. Examples of nonstructural fires include
brush, rubbish, or automobile fires. Other emergencies
include utility emergencies, vehicle accidents, and
stuck elevator rescues.
New York City
Independent Budget Office |
||||
The frequency with which firefighters respond to medical emergencies has increased sharply since the FDNY took charge of the system in 1996. Firefighters were dispatched to roughly 157,000 medical emergencies in 1999, up from just 2,000 medical emergencies in 1993. By 2011, the ratio of medical emergency incidents to fire incidents responded to by firefighters had risen to more than 5 to 1.
Due to the number and location of firehouses throughout the city, firefighters are frequently the first to arrive at the scene of medical emergencies, often stabilizing injured or critically ill patients until an ambulance arrives. On average, firefighters responded in 4.3 minutes to the life threatening medical emergencies to which they were dispatched in 2011. In contrast, the first ambulance to arrive at the scene of medical emergencies did so in an average of 6.5 minutes.
City Ambulance Costs and Revenues. The FDNY operated an average of about 605 ambulance tours per day in 2011. Based on an average cost per tour of $1,731 as reported in the Mayor’s Management Report, the annual cost (including health insurance, pensions, debt service, leasing, dispatching of public and private ambulances, fuel, and other operating expenses) of FDNY-managed ambulance operations was about $382 million. Roughly half of city spending on FDNY’s provision of EMS services is offset by revenues generated from billing private insurance companies, Medicare, Medicaid, and self-paying individuals. In fiscal year 2011, these revenues totaled $177 million.
|
New York City Fire Department Ambulance Costs and
Revenues
Fiscal year 2011 |
||
|
Costs
Average Cost per FDNY Ambulance Tour = $1,731
Average Number of FDNY Ambulance Tours per Day = 605
Total Cost = $382 million |
||
|
Revenue |
|
|
|
Private (Commercial) Insurance |
$83 million |
47% |
|
Medicaid |
$60 million |
34% |
|
Medicare |
$28 million |
16% |
|
Self-Paying Individuals |
$6 million |
3% |
|
TOTAL Revenue |
$177 million |
100% |
|
SOURCES: New York City Fire Department, Mayor’s
Management Report
New York City
Independent Budget Office |
||
The city’s current financial plan estimates that EMS revenue will climb to $203 million this fiscal year, primarily as a result of an increase in fees for ambulance services.
Notable EMS Trends
IBO’s review of EMS response data and other related developments from 1999 through 2011, a period of time that predates the switch to the new 911 system, reveals a number of significant trends. These include an increase—particularly in the first few years—in the average daily number of both FDNY and private ambulances responding to medical emergencies, generally faster response to serious medical emergencies, and a narrowing of interborough disparities in medical emergency response time.
More Ambulances Deployed on City Streets.
On average, there were 976 eight-hour ambulance tours provided each day on city streets in 2011, an increase of 242 tours (33 percent) from the comparable 1999 figure. The overall expansion in ambulance tours stemmed primarily from additional ambulances deployed by private hospitals; 37 percent of ambulance tours were operated by private ambulances in 2011, up from 27 percent in 1999.
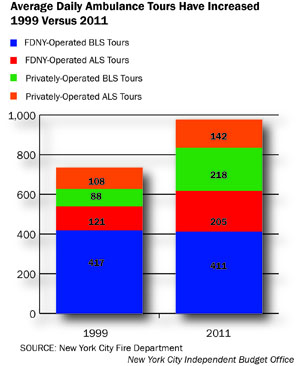
The increase in ambulance tours differed between the two types of ambulance units. There was a 52 percent increase in combined FDNY and private ALS tours, while the increase in combined BLS tours was 25 percent. As of 2011, ALS ambulance tours comprised 36 percent of all tours, up from 31 percent in 1999.
The number of both city and private ambulance tours was rising before 1999, with increases in private tours outpacing increases in city-staffed tours. There were on average fewer than 100 private ambulance tours a day back in 1990, a number which more than doubled by 1999 and continued to grow in subsequent years, reaching 369 in 2002. The Giuliani Administration had encouraged privatization at HHC, and argued that increasing the number of private ambulances in the system was the most cost-effective way to increase the number of ambulance tours by allowing the city to avoid some of the increased staffing and operating costs stemming from the overall expansion of the system.7 The number of city-operated tours also grew between 1990 and 1999, although in this case, much of the growth occurred between 1993 and 1997.8 The increase in city-operated ambulance tours in those years was consistent with the Giuliani Administration’s contention that merging EMS into FDNY would allow paramedics and EMTs who had previously been assigned to supervisory, administrative, and support roles within the Health and Hospitals Corporation to be shifted to providing direct patient services.
Under the Bloomberg Administration, the annual average number of private ambulance tours continued to grow reaching a peak of 401 in 2005, before declining somewhat in subsequent years due to private hospital closures or consolidations. To compensate for the drop in private ambulance tours since 2005 the FDNY increased city-operated tours, with the latter reaching a daily average of 616 by 2011.9
|
Average Daily Ambulance Tours, Combined Advanced Life
Support and Basic Life Support,
City Versus
Private |
||||||||
|
|
1990 |
1995 |
1997 |
1999 |
2002 |
2005 |
2010 |
2011 |
|
Average Number of City-Operated Tours per Day |
475 |
497 |
561 |
538 |
534 |
534 |
591 |
616 |
|
Average Number of Private Ambulance Tours per Day |
94 |
130 |
133 |
196 |
369 |
401 |
358 |
360 |
|
Ambulance Tours per Day |
569 |
627 |
694 |
734 |
903 |
935 |
949 |
976 |
|
Sources:
Mayor’s Office of Operations, New York City Fire
Department
Notes:
Data for 1990-1997 are by fiscal year and taken from the
Mayor’s Management Report. Data for 1999-2011 are
provided by FDNY on a calendar year basis.
New York City
Independent Budget Office |
||||||||
Faster Response to Advanced Life Support Incidents.
Speed is essential in responding to any medical emergency, particularly the most serious emergencies requiring an ALS response by paramedics. Despite a roughly 11 percent increase in the number of ALS incidents between 1999 and 2011, the even more rapid growth in ambulance tours along with the more frequent dispatch of firefighters to medical emergencies has led to swifter responses to these incidents. The median response time of the first ALS ambulance to arrive at the scene of a serious emergency fell from 7.9 minutes in 1999 to 6.5 minutes in 2011, a decline of nearly 18 percent. Over the same period, the median response time for the first ALS ambulance, BLS ambulance, or firefighter unit to arrive at the scene of a serious medical emergency fell more than 14 percent, from 5.6 minutes to 4.8 minutes.10|
Median Response Time Has Declined
Citywide Advanced Life Support Incidents |
|||
|
Median Response Time (in minutes) of First Arriving Unit |
1999 (N=293,655) |
2011 (N=326,116) |
Percentage Change |
|
ALS Ambulance
|
7.9 |
6.5 |
-17.7% |
|
ALS or BLS
Ambulance
|
7.1 |
6.1 |
-14.1% |
|
ALS or BLS
Ambulance or Firefighter Unit |
5.6 |
4.8 |
-14.3% |
|
SOURCE: New York City Fire Department
New York City
Independent Budget Office |
|||
Still Not Meeting ALS Response-Time Goal.
Although EMS response time has improved considerably, in 2011 the city was still falling short of its own longstanding performance objective for responses to Advanced Life Support incidents. Until this year, the FDNY’s stated performance objective was for at least 90 percent of ALS incidents citywide to receive a paramedic-level response within 10 minutes. In 2011, 81 percent of ALS incidents received a paramedic response within 10 minutes, up from 64 percent in 1999. To meet the 90 percent objective in 2011 would have required improved response time for an additional 28,000 ALS incidents (see sidebar).Perhaps of greatest concern are serious medical emergencies in which only a BLS ambulance staffed by emergency medical technicians was dispatched without concurrent or subsequent dispatch of an ALS ambulance, or instances in which paramedics took an exceptionally long time to arrive at the scene of ALS incidents. Significant progress has been made towards reducing occurrences of the former but not the latter. The share of ALS incidents receiving only a BLS-level response fell sharply, from 10.9 percent in 1999 to just 1.7 percent in 2011—from just over 29,000 incidents to about 5,200. But while the share of ALS responses exceeding 15 minutes edged down over the same period, the number of very long ALS responses actually rose from roughly 18,900 in 1999 to over 20,000 in 2011.
|
Faster Advanced Life Support Response to Serious Medical
Emergencies |
||||||
|
ALS Response Time |
1999 (N=293,655) |
2011 (N=326,116) |
||||
|
Number of Incidents |
Percentage |
Percentage (Cumulative) |
Number of Incidents |
Percentage |
Percentage (Cumulative) |
|
|
Within
10 minutes
Agency Goal = 90% |
170,836 |
64.1% |
64.1% |
250,428 |
81.0% |
81.0% |
|
10 to
12.5 minutes |
31,654 |
11.9% |
76.0% |
23,819 |
7.7% |
88.7% |
|
12.5 to
15 minutes |
16,110 |
6.1% |
82.0% |
9,750 |
3.2% |
91.9% |
|
More
than 15 minutes |
18,863 |
7.1% |
89.1% |
20,026 |
6.5% |
98.3% |
|
No ALS response |
29,036 |
10.9% |
100.0% |
5,152 |
1.7% |
100.0% |
|
TOTAL |
266,499 |
100.0% |
100.0% |
309,175 |
100.0% |
100.0% |
|
SOURCE: New York City Fire Department
New
York City Independent Budget Office |
||||||
Response Times by Borough.
Analysis of ALS incident response times at the borough level shows that the share of incidents receiving a paramedic response within 10 minutes improved in each borough from 1999 through 2011. Improvement was most marked in the Bronx where the share of serious incidents receiving an ALS response within 10 minutes climbed from 54 percent in 1999 to 80 percent by 2011. Moreover, interborough disparities declined over the same period. In 1999, the difference between the borough with the greatest share of serious incidents receiving an ALS response within 10 minutes (Manhattan) and the borough with the lowest share (the Bronx) was 17 percentage points. By 2011, the difference had shrunk to 6 percentage points. Brooklyn and Manhattan, each with 83 percent of serious incidents receiving an ALS response within 10 minutes in 2011, came closest to meeting the city goal at the time of at least 90 percent.|
Share of Serious Medical Emergencies Receiving an Advanced Life
Support Response Within 10 Minutes |
|||
|
|
1999
|
2011
|
Difference
(pct pts) |
|
Bronx |
54% |
80% |
+26 |
|
Brooklyn |
63% |
83% |
+20 |
|
Manhattan |
71% |
83% |
+12 |
|
Queens |
70% |
77% |
+7 |
|
Staten Island |
65% |
81% |
+16 |
|
Citywide |
64% |
81% |
+17 |
|
SOURCE: New York City Fire Department
New
York City Independent Budget Office |
|||
Over the 1999-2011 period each borough also had a decline in the number of instances that an ALS ambulance was supposed to show up but never arrived. The decline was most marked in the Bronx, where the share of such incidents fell from 19.9 percent in 1999 to 1.9 percent by 2011. Once again, there was also a decline in interborough disparities over the same period. In 1999, the difference between the borough with the greatest share of serious incidents not receiving an ALS response (the Bronx) and the boroughs with the lowest share (Queens and Staten Island) was 14.9 percentage points. By 2011, the difference had shrunk to 1.4 percentage points.
|
Share of Serious Medical Incidents Not Receiving an Advanced Life
Support Response |
|||
|
|
1999
|
2011
|
Difference (pct pts) |
|
Bronx |
19.9% |
1.9% |
-18.0 |
|
Brooklyn |
10.2% |
1.3% |
-8.9 |
|
Manhattan |
9.0% |
2.2% |
-6.8 |
|
Queens |
5.0% |
1.4% |
-3.6 |
|
Staten Island |
5.0% |
0.8% |
-4.2 |
|
Citywide |
10.9% |
1.7% |
-9.2 |
|
SOURCE:
New York City Fire Department
New
York City Independent Budget Office |
|||
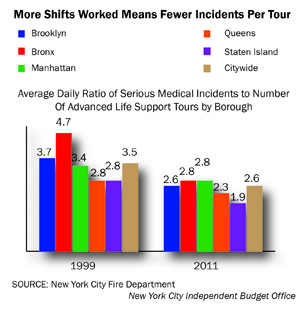
Faster response to ALS incidents by paramedics in each borough is consistent with the sizable increase in combined city and private ALS ambulance tours. Workload, measured by the average daily ratio of serious medical incidents to ALS ambulance tours, dropped in all boroughs and citywide between 1999 and 2011. The biggest decline occurred in the Bronx, where ALS incidents per tour averaged 2.8 in 2011, down from 4.7 per tour in 1999. With fewer incidents per tour, units are more likely to be free to respond promptly to new calls.
|
FDNY Revises Response Time Goal for ALS Incidents The Mayor’s office dropped a longstanding indicator relating to the share of serious medical incidents that received an Advanced Life Support ambulance response within 10 minutes, beginning with the Mayor’s Management Report released on September 19, 2012. The goal of providing a paramedic response to at least 90 percent of ALS incidents within 10 minutes was a component of the 1996 Memorandum of Understanding that accompanied FDNY’s takeover of responsibility for EMS operations. The old management report indicator was replaced with one entitled Response in less than 10 minutes to life-threatening medical emergencies requiring an Advanced Life Support response (%). The new measure reflects the share of ALS incidents responded to within 10 minutes either by paramedics deployed in ALS ambulance units or less highly trained emergency medical technicians deployed in BLS ambulances. The September 2012 management report states that 90.2 percent of ALS incidents in fiscal year 2012 received either a paramedic or EMT response within 10 minutes, up from 87.7 percent in fiscal year 2011. By comparison, fiscal year 2011’s Mayor’s Management Report presented the now discontinued indicator entitled Response time of less than 10 minutes to Advanced Life Support medical emergencies by Advanced Life Support ambulances (%). The reported figure of 80.5 percent reflected the share of ALS incidents that received a paramedic response within 10 minutes. In correspondence with IBO since the September 2012 release of the updated management report, the FDNY has made the case that prior to arrival of an ALS ambulance at the scene of a serious medical emergency, emergency medical technicians staffing BLS ambulance units are often able to arrive within 10 minutes and check the patient’s vital signs as well as perform noninvasive medical procedures. Based on this reasoning, the agency has discontinued use of its prior goal and will instead seek to secure either a paramedic or EMT response within the 10-minute window for at least 90 percent of ALS incidents. |
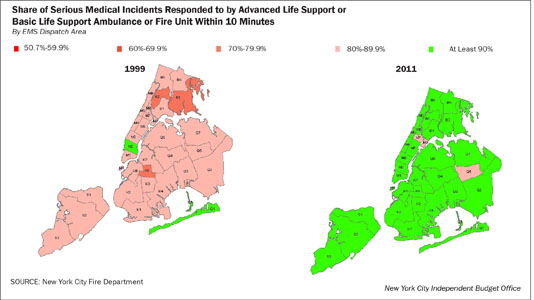
Variations by EMS Dispatch Area. Just as there are differences in EMS response times across boroughs, response times within boroughs also vary. IBO looked at variation in response times across 31 EMS dispatch areas.
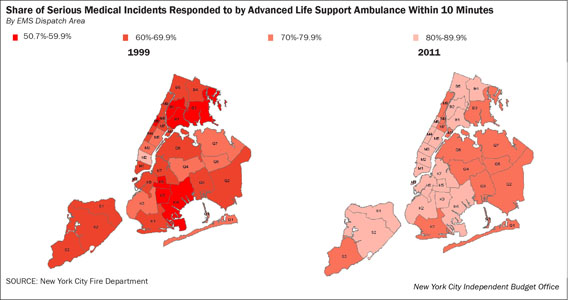
The maps above show the share of ALS incidents in each dispatch area responded to by an ALS ambulance within 10 minutes. In 1999, all five boroughs had dispatch areas in which fewer than 70 percent of ALS incidents received a paramedic response within 10 minutes. By 2011, there were none. Yet throughout Queens as well as in northern Manhattan, southern Brooklyn, northeastern Bronx, and southwestern Staten Island, there were still dispatch areas in which less than 80 percent of serious incidents received a paramedic response within 10 minutes. In 2011, there were still no dispatch areas that met the city’s goal at the time of securing a paramedic response to at least 90 percent of ALS incidents in 10 minutes or less.
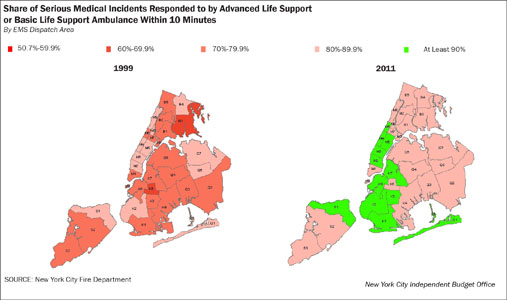
The maps on the below show the proportion of ALS incidents in each dispatch area where the response was either by an ALS or by a BLS ambulance within 10 minutes. Again one can see improvement in ambulance response from 1999 through 2011—several dispatch areas concentrated in midtown Manhattan, Brooklyn, and the northern portion of Staten Island saw at least 90 percent of ALS incidents receiving at least a BLS response within 10 minutes. On a citywide basis, the share of serious incidents responded to within 10 minutes by either an ALS or BLS ambulance increased from 77 percent in 1999 to 89 percent in 2011.
The final set of maps shown below includes responses by firefighters. By 2011, firefighters were extensively involved in responding to medical emergencies so that in all but three dispatch areas 90 percent or more of serious medical incidents received at least a firefighter response within 10 minutes. On a citywide basis, the share of ALS incidents responded to within 10 minutes by either an ALS or BLS ambulance or firefighters increased from 84 percent in 1999 to 93 percent in 2011.
More Ambulances, Faster Responses
The timeliness of responses by paramedics to serious medical emergencies has improved since 1999. A significant factor aiding the improved response time is the sizable increase in the average daily number of FDNY and private ambulances deployed on city streets in recent years. The number of private ambulance tours grew rapidly in the late 1990s and early 2000s even as the number of city ambulance tours was also growing, although at a slower pace. As a result, the share of tours provided by private ambulances grew from 17 percent in 1990 to 43 percent in 2005. As a number of private hospitals have closed or consolidated, the share of private ambulance tours has fallen somewhat and the FDNY has added city ambulances to compensate. By 2011, the share of private ambulance tours had fallen to 37 percent.
Despite the improvement from 1999 through 2011 in the timeliness of paramedic response, the city was still falling short of its goal of securing a paramedic response within 10 minutes to 90 percent of Advanced Life Support incidents. The FDNY’s commitment to this goal was included in the Memorandum of Understanding that accompanied the 1996 takeover of responsibility for EMS operations by FDNY. However, in the Mayor’s Management Report for fiscal year 2012, the fire department’s goal had changed to delivering either a paramedic or EMT response within the 10-minute window at least 90 percent of the time—a goal which was met that year.
Report prepared by Bernard O’Brien,
With assistance by Christina Fiorentini, Nashla Salas, and Asa Wilks
Endnotes
1
There are also a small number of volunteer neighborhood-based or religiously affiliated ambulances seen on city streets. However, these ambulances do not participate in the 911 system in the sense that they are not dispatched by FDNY dispatchers and therefore not included in the data we analyzed. Even in instances in which one of these volunteer ambulance units arrives on the scene of a 911-generated emergency, an FDNY or private hospital ambulance would also be dispatched.2
Based on interview with staff of Greater New York Hospital Association. Also, in November 2010 the Bloomberg Administration announced plans to begin charging private hospitals a "dispatch fee" for the right to participate in the 911 system. However, imposition of the fee has been delayed pending the outcome of ongoing negotiations.3
There has long been controversy about how closely this protocol is followed. For example, former City Comptroller Alan Hevesi examined this issue in detail in a June 2001 report entitled "Where Do 911 System Ambulances Take Their Patients?"4
The terms Advanced Life Support incidents and "serious medical emergencies" are used interchangeably throughout this report.5
All references to years in this report are calendar years unless otherwise noted.6
Although the Bloomberg Administration has appealed in the past to the New York City Regional Emergency Medical Council—the state-created group that regulates ambulance staffing—to allow city ALS units to be staffed with one paramedic and one EMT, the policy has not been changed.6
FDNY Commissioner Von Essen, March 28, 2000, cited in Hevesi 2001 report, pg. 1.8
Hevesi 2001 report, pg. 6.9
In 2010, the city added tours to make up for the loss of tours from Caritas, Westchester Square, and Lady of Mercy hospitals. For 2011, tours were added in response to the closing of St. Vincent’s.10
There were also double-digit percentage declines in the mean response time of the first arriving ALS ambulance, BLS ambulance, or firefighting unit.PDF version available here.