
December 2017
From Grades 3 to 8:
Tracing Changes in Achievement Gaps by Race & Gender in New York City Public Schools
PDF version available here.
Summary
The existence of racial and other achievement gaps in the city’s schools has been a major concern for parents, educators, and policymakers for some time. In this report, IBO documents the extent of achievement gaps among third graders in school year 2008-2009 and then traces how those gaps evolved for this cohort of students through the eighth grade. The report includes students in traditional public and charter schools.
We measure achievement gaps based on New York State test score results and examine them in terms of student race and gender while accounting for factors such as family income, English language learner status and disability status. Also considered is the evolution of achievement gaps among initially high- and low-performing students. Among our findings:
- There were substantial racial achievement gaps among third grade students in 2008-2009 in both reading and math. In English language arts, average scores for white and Asian students were similar, and while the average score for black students exceeded the average for Hispanic students, black students’ average score lagged behind the averages for white and Asian students. The gender gap in reading was widest among black students, with females scoring higher than males; it was narrowest for Hispanics.
- In math, Asian students in our third grade cohort substantially outperformed the three other racial groups, but unlike in English Language Arts, Hispanics outperformed black students, on average. The gender gap in math was widest among black and white students, with females scoring higher, but the differences were small across races and smaller than those in English Language Arts.
- By eighth grade (seventh grade for math), a number of achievement gaps had widened. In English Language Arts, Asian students progressed rapidly while black student performance deteriorated sharply compared with students from other races. Additionally, gender gaps increased within each race.
- In math, Asian students had on average the biggest rise in scores while Hispanic and black students experienced sharp declines in relative scores. Both white males and Asian males made more progress than their female peers, narrowing these gender gaps. But black male students fell further behind black female students.
The report also finds that the cohort of 2008-2009 students we examined attended segregated schools—80 percent of elementary schools had students of one race in majority despite the city’s racial diversity. Patterns of grade retention, special education classification, and suspensions mirrored the sorts of disparities by race and gender seen on the statewide tests.
Large achievement gaps—by race, gender, and income—have been one of the most persistent and disquieting facts of K-12 education in the U.S. Narrowing these gaps is a priority for schools and policymakers.
This report uses standardized test scores to analyze racial and gender achievement gaps for students in New York City’s public schools. Choosing a recent cohort consisting of third graders in school year 2008-2009, it explores the nature of the gaps in elementary grades and how these evolved as students in this cohort progressed through school. Particular attention is devoted to how the racial and gender achievement gaps evolve for initially high-performing students compared with initially low-performing students. New York City is perhaps the country’s most diverse large city in terms of its student composition, with strong representations of students from all major racial groups. This diversity affords one a unique opportunity to document the magnitude of the racial achievement gaps, concentrating not only on the black-white gap as in most of the literature, but also the Hispanic-white gap and the gaps between Asian students and other racial groups.
The starting point of the analysis is the magnitude of racial achievement gaps in third grade, the grade when annual testing administered by New York State begins in the city’s public schools. We consider the entire distribution of test scores for each of the four major racial groups—Hispanics, blacks, whites, and Asians—rather than focus only on the averages.1 The study then follows this particular cohort over time through the eighth grade. We examine not only the evolution of achievement gaps across the four groups, but also how other school-related measures such as mobility (changing schools), grade progression, and special education classification vary across students and over time. In each case the trends for initially high- and low-performing students, as these evolve over late elementary and middle school grades, are analyzed separately.
Achievement Gaps and the Labor Market. Why should one be concerned about achievement gaps? Recent research suggests significant effects of academic achievement, as captured in performance on standardized tests, on future educational accomplishments as well as future labor market outcomes. Chetty, Friedman, and Rockoff (2014) argue that test scores comprise an early predictor of educational attainment and adult incomes, with higher test scores being associated with higher probability of attending college, earning higher salaries, living in higher socioeconomic status neighborhoods, and having higher savings rates.
Given the large disparities in wages and earnings by race, many studies have confirmed that to a considerable extent these can be attributed to differences in cognitive skills obtained prior to entering the labor force, as measured by achievement test scores. For example, researchers have found that half or more of the male black-white wage gap can be accounted for by black-white differences in skills and knowledge, as reflected by scores on the Armed Forces Qualification Test taken when individuals were on the verge of finishing high school (Carneiro, Heckman, and Masterov, 2003; Neal and Johnson, 1996). Evidence from the National Longitudinal Survey of Youth suggests the same for Hispanics; Carneiro, Heckman, and Masterov (2003) argue that test score differences can account for most of the male Hispanic-white wage gap. A recent study (Lin, Lutter, and Ruhm, 2016) finds that cognitive performance, as measured in end-of-schooling test scores, is positively associated with future labor market outcomes at all ages and that the returns are higher for women compared with men and for blacks and Hispanics compared with whites.
The increase in the returns to education since the 1980s has been the largest for those in the top quartile of the achievement distribution (Heckman and Vytlacil, 2001), with whites and Asians overrepresented statistically. As a result, researchers like Reardon, Robinson-Cimpian, and Weathers (2016) argue that such racial concentration at the high end has become increasingly salient in shaping labor market inequality. This report, by tracking academic performance of a recent cohort of students as it progressed through school, highlights not only the overall widening of racial gaps over time but also how these gaps differ by gender, subject, and initial performance. Earlier work on New York City public school students had examined the extent of the racial gap in test scores in grades 5 and 8 in school year 2000-2001 (Stiefel, Schwartz, and Ellen, 2006). This report takes advantage of the current regime of annual testing in grades 3 through 8 and a panel data framework to further our knowledge about evolution of racial and gender achievement gaps.
Data and Study Sample
Data The analysis in this study is primarily based on individual student records that have been obtained from the city’s Department of Education (DOE). These data contain detailed information on student background, including demographic characteristics (gender, race, and whether a student is eligible for free or reduced-price lunches, which serves as a proxy for poverty), classification as an English language learner (ELL), and whether receiving special education services.2 All students attending New York City public schools, including those in charter schools, are included in the data. The data also contain information about school moves, attendance, suspensions, and test scores. Because of the sensitive nature of all this information, DOE removed personal identification from the student records before providing the data to IBO.
Students in New York City public schools take New York State tests in English Language Arts (ELA) and mathematics in grades 3 through 8. Performance on these annual tests, administered to all students in public schools, form the basis of our exploration of the magnitude of racial achievement gaps.
The metric used throughout the study is student test scores on these annual New York State tests, standardized by subject and grade in each year. Consistent with other researchers, we call this standardized measure the z-score. Converting actual test scores into z-scores has the advantage of easy interpretability. A z-score can be constructed by particular grade-subject-year combinations. The average z-score for a particular grade-subject-year is 0 and the standard deviation of z-scores is 1. A z-score of -0.25 implies that the student scores 0.25 standard deviation units lower than the average student in that grade, subject, and year (and vice versa for z-scores above zero). Students are compared with their peers within the same year-subject-grade combination. Because these tests are not “vertically aligned,” meaning they cannot be compared across grades, caution should be exercised in comparing scores from grade to grade. But most of our comparison is relative in nature as we highlight racial and gender differences in student performance at different grades. In comparing trajectories of student achievement across various races, this report focuses on relative gains in terms of differences in z-scores (e.g., black-white gaps as measured in z-scores in various grades) rather than absolute gains.
Construction of the Baseline Sample. We start out with all students attending a public school in New York City in third grade in school year 2008-2009. This cohort, whose members reached eighth grade in 2013-2014 under standard grade progression, was the most recent one for which data was available as this project began. Since the focus of the study is on examining patterns of racial achievement gaps, we exclude students who did not have third grade test scores in either ELA or mathematics. The final sample includes 71,530 students who were enrolled in a New York City public school (traditional public schools and charter schools) in third grade in 2008-2009, took both the third grade tests in that year and have complete third grade records with regard to demographics and test scores.3
The study looks solely at students in public schools because our focus is racial and gender achievement gaps.4 Roughly a fifth of New York City students attend private schools and, more importantly, the share of students in private schools differs markedly across races. For example, over 60 percent of students attending private schools in New York City are white, and the shares of Hispanic and black students in private schools are only 14 percent and 13 percent, respectively.5
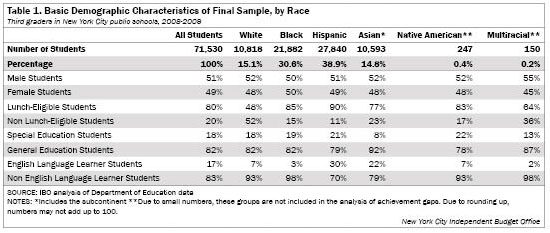
The cohort that this report studies is racially diverse, but a large majority of the students come from disadvantaged families (Table 1). About 39 percent of the students are Hispanic and comprise the largest racial group. About a third of students are black, with 15 percent white and another 15 percent Asian. The share of female students is just less than half overall, and this is also true of most individual races. The families of white students are better off financially compared with students from other races, based on eligibility for free or reduced-price lunch. Hispanic students are on average the most likely to be impoverished, followed by black students. More than three-quarters of Asian students also come from poor families.
The share of white third graders classified as special education students is similar to their black and Hispanic peers. In contrast, Asian students have a much smaller incidence of being classified in special education. Black students are less likely to be classified as ELL than whites and, not surprisingly, both these groups are far less likely to be English learners than Hispanics and Asians.
Student Achievement and Racial Achievement Gaps: Third Grade
This report examines racial achievement gaps in multiple ways. First, it looks at the distribution of student test scores by race and gender and documents the respective shares of students from each group at the lower end (25th percentile), at the median (50th percentile) and at the top end (75th percentile). Second, it looks at average performance of students belonging to various races by comparing their average z-scores (standardized scale scores). Lastly, using a regression framework, the report explores how much of the achievement gaps can be explained by student socioeconomic background and school-level characteristics. Individually, each of the above highlights an important dimension of student achievement. Together, they portray a fuller picture of racial achievement gaps, spanning the whole range of student performance, and also allow us to see how individual-, family-, and school-level factors are associated with these gaps.
When this report refers to average z-scores, it implies the mean z-score among all the students of a particular subgroup (defined by race, or by both race and gender, or by other characteristics like poverty or ELL status). In addition to exploring levels and trends in average z-scores, the report also separately tracks the evolution of performance among initially high-performing students and among initially low-performing students.
The cohort of third graders in 2008-2009 had significant achievement gaps by race, with some differences across the two subjects. In ELA, the average Asian student performed as well as the average white student, but white students had an edge at the top of the distribution (75th percentile) and there were fewer white students compared with Asian students at the lower end (25th percentile). The average black student did better than the average Hispanic student, but there were big differences between them and Asian and white students. In mathematics, Asian students outperformed all other groups and, unlike for ELA, Hispanic students outperformed black students.
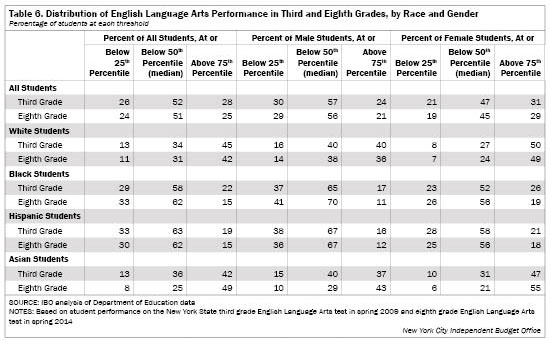
Distribution of Test Scores: ELA. There are disparities in the distribution of ELA test scores in third grade across racial groups, and often these get magnified when further broken down by gender (Table 2, top panel). Relatively few white and Asian students scored in the bottom quartile (at or below the 25th percentile). Conversely, most of them are concentrated in the top quartile (at or above the 75th percentile). A third of Hispanic students scored in the bottom quartile, and the share is similar among black students, too. Conversely, fewer than 20 percent of black and Hispanic students scored at or above the 75th percentile, compared with over 40 percent of white and Asian students.
Female students had an edge over their male peers across the board in ELA, with meaningfully lower shares at both the 25th and 50th percentiles and a higher share at the 75th percentile. The female advantage held true for students from each of the four races. But there were differences in the extent of this advantage. For example, the female advantage in terms of having a smaller share of low-performing students was larger for white students compared with Asians, and for black students compared with Hispanics.
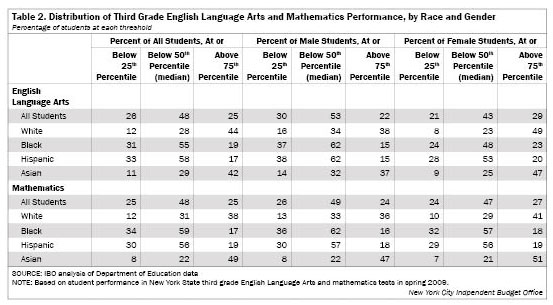
Distribution of Test Scores: Math. Asian students led students from other races in third grade mathematics, outperforming white students at the top and the bottom of the distribution (Table 2, bottom panel). Only 8 percent of Asians scored in the bottom quartile, compared with almost half scoring in the top quartile. Black and Hispanic students were more heavily represented in the lower half of the test score distribution, with about a third scoring in the bottom quartile. But Hispanic students had an edge over black students.
In mathematics male students again trailed their female counterparts, but gender differences in math were relatively small compared with gender differences in ELA scores. The female advantage held true for students from each of the four races but, like for ELA, there were differences across them. As in ELA, black students had the highest gender gap in the bottom quartile. Note that over the range of ELA and math scores, the gender gap for Asian students was always narrower than the respective gap for white students.
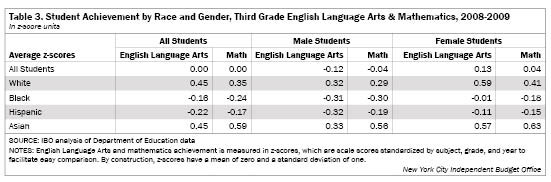
Average Performance Overall and By Race and Gender. This variation in performance across various subgroups is reflected in average z-scores (Table 3). As noted earlier, z-scores are useful as a measure that sums up the performance of an entire subgroup, thereby facilitating easy comparisons. White and Asian students had higher averages in ELA while both Hispanic and black students lagged behind considerably. White female students outperformed Asian female students, but the converse was true among male students, though the differences are small. Hispanic male students posted the lowest scores, closely followed by black male students. Both black and Hispanic female students were way ahead of their male peers. Generally, within each race, the female advantages in terms of having a smaller share of low-performing students and a larger share of high-performing students were similar for math compared with ELA.
In third grade mathematics, Asian students had the highest average scores, followed by white students at a considerable distance. As in ELA, female students had marked advantage over male students. The achievement of black students lagged behind. There was a large gap between black and Hispanic females in ELA and a large gap between black and Hispanic males in mathematics.
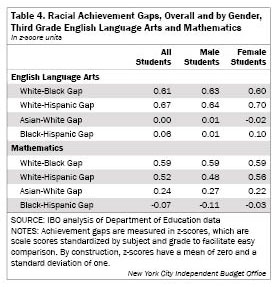
Racial Achievement Gaps in Third Grade. Comparing average z-scores across groups of students, we find large racial achievement gaps in both subjects in third grade, both overall and separately for male and female students (Table 4). In ELA, the average black student scored 0.61 z-score lower than the average white student. At 0.67 z-score, the gap between white and Hispanic students was even larger.6 Asian students scored on par with their white counterparts, so the Asian-black and Asian-Hispanic gaps (not separately reported in the table) mirror those with respect to white students. The black-Hispanic gap is small but positive at 0.06 z-score.
The white-black gap in mathematics, at 0.59 z-score, was similar to that in ELA, but due to higher average performance by Hispanic students compared with black students, the white-Hispanic gap was smaller than the white-black gap. By virtue of their higher scores, Asian students had a distinct edge over white students.
Using Regression Analysis to Control for Difference Across Students and Schools
Students belonging to various racial groups differ in many attributes, including differences in socioeconomic status, in special education and ELL classifications, and in schools attended. These differences are also systematically associated with students’ performance on tests. Our analysis follows the literature in using a multivariate regression framework to calculate adjusted achievement gaps that control for differences across students and schools. The controls typically used fall into two broad categories: student-level variables that measure individual students’ background and family characteristics and school-level variables that measure different aspects of schools they attend. Once these variables are accounted for, racial achievement gaps shrink considerably, underlining the fact that much, though not all, of raw differences in performance across various races reflect differences in their individual-level and socioeconomic background and in schools attended.
We run the following regression
yirs= α +∑ βr * Dr + ∑ γ * Xirs + ∑ δ * Ss + εirs
Here the dependent variable yirs is the z-score (standardized scale score) of student i from race r attending school s in 2008-2009. The Drs are dummy variables for individual races. For example, DBlack takes the value of 1 if the student in question is black, 0 otherwise. White students comprise the omitted category, so a negative coefficient on a race dummy signifies a disadvantage for that racial group with respect to whites, and vice versa for a positive coefficient. Xirs are the individual control variables. The analysis includes a student’s gender and eligibility for free or reduced-price lunch, in addition to indicators for classification as a special education student and as an ELL student. We run ordinary least squares (OLS) as well as fixed-effects (FE) regressions. In the former case we include variables (Ss above) related to peer composition at the school level (shares of students belonging to different races, share of poor students). In the latter case we include a separate fixed effect for each school in the study to control for differences across schools, such as peer composition, resources, and building conditions, which affect students from each race similarly. Separate (but identical) regressions are run for ELA and for mathematics. Standard errors are clustered at the school level, to account for potential correlation among students attending the same school.7
Regression Results: ELA. There is a noticeable decline in the magnitude of racial achievement gaps once we control for the combined effects of the various background factors (Table 5). Columns (1)-(3) and (5)-(7) report estimated coefficients from OLS regressions, while columns (4) and (8) report on the fixed effects regression. We start off with the raw achievement differentials in column (1), then progressively add more variables, including school fixed effects in the FE regressions. In columns (3) and (4) we interact the male dummy variable with individual race dummies to pick up race-by-gender interaction effects.
The coefficient on the black dummy variable in column (1) is -0.61, showing that the unadjusted white-black test score gap in ELA is 0.61 z-score. The following column includes variables related to gender, poverty, and special education and ELL status of individual students—factors that help to account for differences in background characteristics that might directly affect test scores. (For example, the dummy variable “Lunch-eligible” helps account for the fact that poor students, signified by eligibility for free or reduced-price lunch, score lower than better-off students and that black students are more likely to be poor compared with white students; see Table 1.) All of these variables are highly statistically significant in predicting student achievement, and the black-white test score gap declines to 0.54 in column (2). Including school-level indicators of student peer composition or school-level fixed effects narrows the gap down to 0.30 z-score. While this is half of the original gap, it also implies that there exist large and statistically significant achievement gaps even within schools.8
The unadjusted white-Hispanic gap in ELA is 0.67 z-score, declining to 0.40 z-score if we include gender and poverty, as well as special education and ELL statuses, as additional regressors. The gap further reduces to 0.25 z-score if we include school-specific factors. There is no Asian-white gap when one looks at the raw numbers, but controlling for student and family background leads to a statistically significant gap of 0.07 z-scores in favor of Asian students, underlining their more disadvantaged family circumstances compared with white students. The Asian-white gap increases further when school-level variables are added.
In this 2008-2009 cohort, male students lagged behind their female peers. But there were considerable differences by race, as revealed by the gender-race interaction terms included in columns (3) and (4).9 Coming from a relatively poor family, which makes one eligible for free or reduced-price lunches (our measure of family poverty) has a statistically significant association with lower test scores. Note that the effect is considerably reduced when we include school-level indicators, either school peer composition in column (3) or school fixed effects in column (4). This suggests that some harmful effects of poverty operates through the school as much as through the individual and her family. Among the school-level peer composition variables, both share of black students and share of Hispanic students negatively affect performance—the coefficients are similar and highly statistically significant. The coefficient on the share of poor students is also negative and statistically significant, but its magnitude is smaller—the share of Asian students has no effect on the achievement gaps. As expected, there is a statistically significant association between being classified as an ELL student and lower performance on ELA tests. Also, special education students lag behind their counterparts in general education by a wide margin.
| Different School Experiences for Students of Different Racial Groups
While the focus of this report is on racial and gender gaps in student achievement over time, we examined some of the ways in which school experiences of students from different racial backgrounds vary. We summarize our findings here and provide supporting tables and graphs in online appendicies A and B of the report. In what follows, students were classified as high-performing if they scored in the highest quartile in terms of third grade mathematics, and low-performing if they scored in the lowest quartile. Results were similar if students were classified in terms of ELA scores instead of mathematics scores. Racial Segregation. A 2014 study from the Civil Rights Project at the University of California, Los Angeles documented high levels of segregation by race in New York City’s public schools—both traditional and charter. Based on our cohort of third graders in 2008-2009, New York City public schools were segregated along racial lines (Table A-1). Just over 40 percent of schools had 5 percent or more of white students, similarly for the share of Asian students. Still, whites constituted a majority in 10 percent of schools and Asians are a majority in another 6 percent, though each group only accounted for 15 percent of students citywide. Blacks and Hispanics were a majority in about 30 percent of schools each. Overall, despite the racial diversity of the student body, almost 80 percent of New York City public elementary schools had students from one race in the majority. This level of segregation, combined with the racial gap in achievement scores, resulted in a highly skewed concentration of high-performing students (Table A-2, panel B) in 2008-2009. A white high-performing student attended a school with a very different peer composition compared with either a high-performing black student or a low-performing white student. A high-performing black student attended a school where 26 percent of students were similarly high-performing and 25 percent low-performing. In contrast, a high-performing white student attended a school with larger shares of high-performing peers and smaller shares of peers who were low-performing, 40 percent and 12 percent, respectively. High-performing black and Hispanic students were enrolled in schools that were often more similar to the schools attended by their same-race low-performing peers than schools attended by high-performing white and Asian students. School Attrition and Mobility. Overall attrition from New York City public schools was not high during elementary and middle school years. Of the original cohort, 86 percent was still attending the city’s public schools in 2013-2014 (Table A-3). There were only minor differences across races: Hispanic students had the lowest attrition rate while white students had the highest attrition. When students were disaggregated by initial performance, there was little variation in attrition among high-performing students. White low-performing students left at higher rates compared with Asian low-performing students but the differences with respect to other students were small. The city’s school population tends to be more mobile in late elementary grades than in higher grades, with 22 percent of third graders in our cohort transferring to another city public school or leaving the system (Table A-4), compared with 14 percent of students in middle school (Table A-5). There were significant differences by race, which were mostly accounted for by differences in rates of transferring to another city public school. White and Asian students were more likely to remain enrolled in their original schools either during elementary school years or during middle school years (Table A-4). In contrast, black students had the highest rate of leaving. Within each race, high-performing students were more likely to remain in their original school than their low-performing peers. Again, this was true both during late elementary school years and, except for Asian students, during middle school years. We do not find school transfers during elementary grades to be systematically related to characteristics of the incoming school, as measured by peer composition (Table A-6), except in a few cases. When Asian students transferred schools, they tended to move to schools with smaller shares of low-performing students and higher shares of high-performing students. This was true both for Asian high-performers and Asian low-performers. White high-performers also chose schools with better-performing peers when they moved. But black and Hispanic high-performing students moved to schools with smaller shares of high achievers and larger shares of low achievers. Middle School Choice. Overall and within individual races, there are few differences between peer composition, measured as the shares of low-performing and high-performing peers, at middle schools compared with that at elementary schools, despite a higher degree of school choice at the middle school level (Table A-7). For students from each of the four races, the share of low-performing peers in middle school was similar to the corresponding share from elementary school, and the same was the case with respect to high-performing peers. This basic pattern prevails if we separately look at low-performing students and high-performing students within each race, though high-performing students of each race (other than Hispanics) tended to move to schools with slightly larger shares of high-performers. Given that prior research has found substantial influence of middle school on high school choices and outcomes—either directly through teachers, principals, and other school inputs, or indirectly through student peer groups—these findings have important policy implications.10 Grade Progression. Overall, 92 percent of the original cohort who did not leave the city’s public schools was enrolled in eighth grade or above in 2013-2014, as would be expected under standard grade progression (Table A-8). There were significant differences by race: 98 percent of white and Asian students had progressed on schedule, compared with 88 percent of black students and 91 percent of Hispanic students. As would be expected, low-performing students were less likely to proceed on schedule than their high-performing peers. Nearly 20 percent of initially low-performing students were enrolled in grades below eighth grade in 2013-2014, compared with less than 1 percent of students who started out as high-achievers.11 These differences in grade progression have an important effect on calculations of racial achievement gaps. Low-performing students repeat a grade at higher rates, and black and Hispanic students are more likely to be relatively low-performing compared with white and Asian students. Thus, fewer black and Hispanic low-performing students attended the same grade as the rest of the cohort and took the same tests, which may have the effect of understating our estimates of achievement gaps in both seventh grade and eighth grade. Special Education Classification. There was a small but continuous rise throughout the late elementary and middle school grades in the share of students with disabilities (Appendix B, Table A-9). In 2008-2009, when cohort members were enrolled in third grade, there were some differences across races in the share of students classified as special education: 21 percent of Hispanic students, 19 percent of black students, 18 percent of white students, and 8 percent of Asian students. These differences widened further by 2013-2014 as the share of Hispanic and black students with disabilities rose to 26 percent and 24 percent, respectively, while the share of white and Asian students with disabilities declined. There are racial differences both in declassification of existing special education students and in new classifications. Also, a much larger share of initially low-performing students were newly classified as needing special education services.12 Student Suspension. We examined suspension rates in middle school, as suspension is relatively rare in elementary grades and operates under a different disciplinary code of conduct. There were considerable differences in the frequency and duration of suspensions by race and gender during middle school years (2011-2012, 2012-2013, and 2013-2014; Table A-10). Close to 20 percent of black males were suspended, for an average of nearly five days, compared with 14 percent of Hispanic males, who were suspended for two days on average. Suspension rates were lower for white and Asian male students, 11 percent and 8 percent, respectively. Asian female students had the lowest rate of suspensions, averaging less than 2 percent. These differences in suspensions by race and gender persisted when looking at low- and high-performing students separately. |
Regression Results: Mathematics. The results for mathematics are similar to those in ELA (also see Table 5, columns 5 through 8). The raw white-black test score gap in mathematics is 0.59 z-score, almost identical to the raw white-black gap in ELA. This declines to 0.53 z-score after controlling for gender, poverty, and disability and ELL status. Including school-level variables, the gap further narrows to about 0.36 z-score.
The raw white-Hispanic gap is smaller than the white-black gap. The difference between the two gaps becomes larger when we control for gender, poverty, and disability and ELL status (column 6) and further for school-level variables (column 7). After controlling for both individual and school-level factors, the difference between the black and Hispanic coefficients is much larger in mathematics compared with ELA, underscoring the differences between black and Hispanic students’ performance on the mathematics test. With respect to white students, however, the Hispanic disadvantage in ELA is virtually the same as in math, once other variables are adjusted for.
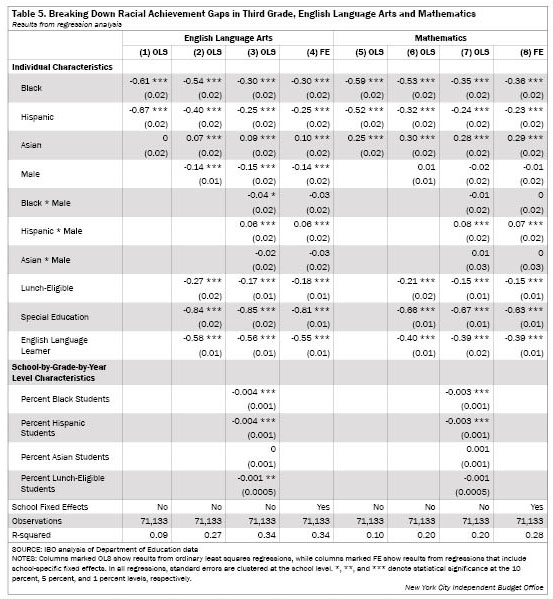
Unlike in ELA, the Asian advantage in mathematics is manifest even in raw numbers. The advantage increases as we include more explanatory variables, but the impact of additional controls is much more muted compared with that for black and Hispanic students, hovering around a narrow band.
Most individual and school-level control variables have the usual signs. The estimated coefficients on the poverty indicator, disability status, and ELL status are each statistically significant, though the magnitudes are usually somewhat smaller compared with their impact on ELA (Table 5). Among the school-level variables, share of black students and share of Hispanic students are negatively associated with performance, with the coefficients similar to the ones we found earlier for ELA.
Robustness Check. Many public schools in New York City do not have an even mix of students from various races (see Appendix A online for a fuller treatment of school-level clustering of students by race). So to check the robustness of these results, we ran the same regressions using only schools with an “adequate” number of third grade students from multiple races. For example, we reran regressions for the white-black gap including (i) only schools with at least five white and five black students; (ii) only schools where white and black students each comprise at least 5 percent of the enrollment; and (iii) only schools satisfying both (i) and (ii). The results remain qualitatively very similar, with statistically significant racial achievement gaps existing even for these smaller samples.
Summary of Achievement Gaps in Third Grade. There already exist significant achievement gaps by race, gender, and special education and ELL status in third grade. In ELA, the average Asian student performed as well as the average white student, but there were more high-performing, and fewer low-performing, white students compared with Asians. The average black student did slightly better than the average Hispanic student, but there were significant differences between these groups and Asian and white students. The gender gaps in achievement were highest for blacks, and lowest for Hispanics—but generally of similar size across racial groups.13 The regression results show large gaps in performance between students in special education and their peers in general education. As expected, there also exist wide gaps in ELA scores between ELL students and non-ELL students.
The results for third grade mathematics performance are similar. Asian students significantly outperformed all other groups and, unlike for ELA, Hispanic students outperformed black students. The gender gaps were smaller in mathematics than in ELA, but female students still had the advantage. Similar to the results for ELA, the gender gap in mathematics was higher among black and white students compared with Hispanic and Asian students—but differences across races were small. Though smaller than the corresponding gap in ELA, there was still a large gap in mathematics scores between ELL students and non-ELL students.
Evolution of Student and Racial Achievement Gaps
This section documents how student achievement, measured by performance on annual New York State tests, evolved during late elementary and middle school grades. As with results reported earlier for third grade tests, student performance is broken down by race and gender within each subject. In addition to looking at the averages of all students within each race, we also separately describe how initially high- and low-performing students from each race performed in these tests over the years.
For the purposes of this analysis, the sample is restricted to students from the original cohort who remained in city public schools, advanced according to the standard grade progression, and took the state tests in the appropriate year. That is, we include only those students for whom we have a third grade test score in school year 2008-2009, fourth grade test score in 2009-2010, fifth grade test score in 2010-2011, sixth grade test score in 2011-2012, seventh grade test score in 2012-2013, and eighth grade test score in 2013-2014. The number of students in this sample is the same in each year over this six-year period.14 Students who left New York City public schools and students who were retained in a grade are excluded from these calculations, the former because of a lack of achievement data and the latter because they were not attending the same grade as the rest of the cohort (and thus did not take the same tests).
A small but important share of students is retained in a grade (see online Table A-8). Of more relevance is the fact that the incidence of grade retention varies by race and hence plays a small but important role in evolution of racial achievement gaps. In particular, as low-performing students are retained at much higher rates and black and Hispanic students are relatively more likely to be low-performing compared with white and Asian students, comparing only members of a cohort who are in the same grade in a particular year leads to an underestimation of racial achievement gaps. The problem is less severe for student attrition, as online Table A-33 shows few large and systematic differences in attrition rates across students belonging to various races (except a moderate gap between white and Asian low-performing students in terms of attending city public schools in 2013-2014).
For ELA, we compare student performance in the third grade to that in the eighth grade.15 For mathematics, because a new rule in 2013-2014 allowed Regents mathematics examinations in eighth grade, we compare student performance in third grade math to that in the seventh grade.16 For each subject, we first summarize the entire distribution of student performance by race across grades, followed by a comparison of their average test scores (z-scores) over time. Finally, we analyze the magnitude of racial achievement gaps, first in terms of z-scores and then by a multivariate regression analysis exploring the association of student achievement with various individual- and school-related factors. In each case data on race are further disaggregated by gender.
From Elementary to Middle School: Changes in ELA Test Score Distribution. Across the years, students of different races diverged considerably in terms of performance on New York State tests in ELA. This can be seen in Table 6, which reports the shares of students from each race who scored at various percentile cutoffs.17 There were relatively few white and Asian low-performing students in third grade; the share of white and Asian students scoring at or below the 25th percentile was only 13 percent. Over the years Asian students improved at the fastest rate and in eighth grade just 8 percent of Asian students were in the low-performing category. In contrast, the share of low-performing black students—scoring at the 25th percentile or below—rose from 29 percent in third grade to 33 percent in eighth grade. Hispanic students saw some improvement from grades 3 to 8, with the share of low performers declining from 33 percent to 30 percent. But Hispanics continued to lag Asian and white students by a large margin.
Black students lost ground to students from other races—a larger share of black students scored at the lower end and a smaller share scored at the top end. This relative decline led to the disappearance of the black-Hispanic gap that had existed in elementary grades. Asian students improved by more than any other race. Although a larger share of white students compared with Asians had scored at or above the 75th percentile in third grade ELA, in eighth grade the situation was the reverse.
From Elementary to Middle School: Changes in Math Test Score Distribution.The trends in mathematics performance across various racial groups, reported in Table 7, are similar to those for ELA. The Asian-white gap at the 75th percentile, but not at the 25th percentile, grew larger after third grade. Black students were disproportionately overrepresented in the lowest quartile and underrepresented in the top quartile in third grade compared with their peers from other races, though Hispanic students were not too far off. But black students lost further ground during elementary and middle school years. From third grade to seventh grade, the share of high-performing black students declined from 19 percent to 12 percent and the respective decline for Hispanic students was from 20 percent to 14 percent.

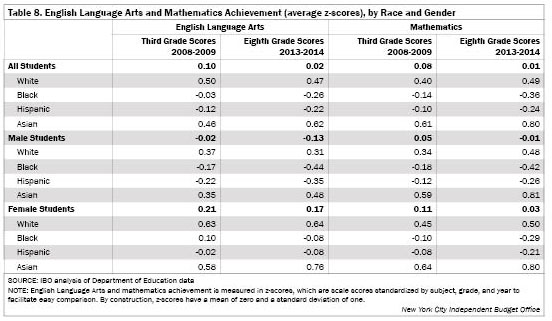
Changes in Average Test Scores, Elementary and Middle School. When we compare average student performance, as measured by z-scores, for students across elementary and middle school grades, we find significant racial differences.18 The results for ELA, reported in Table 8, portray the same underlying trends as Table 6. Asian students demonstrated rapid progress while black student performance deteriorated sharply relative to students from other races. Hispanic students’ average z-scores also declined, but less steeply than for blacks. Looking separately at male and female students, white females and Asian females registered larger gains in terms of z-scores than their male counterparts, although having considerable advantage already in third grade. Similarly, for both black and Hispanic students, relative declines are more pronounced for male students compared with female students. An interesting result is that gender gaps increase within each race, despite already large gaps in third grade.
The results for mathematics, also in Table 8, reflect similar patterns of academic progress. There was modest improvement by white students, with their average z-score rising from 0.40 to 0.49. As in ELA, Asian students saw the biggest increase in average z-scores, despite their large initial advantage. Conversely, there was a large relative deterioration in the performance of black and Hispanic students, despite already large gaps in third grade. Black students suffered the largest decline relative to the other groups, and the small advantage Hispanic students had over black students in third grade became much larger in seventh grade. Broken down by gender, white males registered greater progress than their female peers and the gender gap narrowed significantly. Asian male students outpaced their female counterparts, too. While there were gains by each group, the gender gap reversed sign. For black students, relative declines were larger in magnitude for male students compared with female students, mirroring the trends in ELA performance. For Hispanic students, the relative declines across the genders were on par.
Evolution of Test Scores for Intially Low- and High-Scoring Students
A primary goal of this report is to examine how third graders at very different levels of performance progressed from elementary through middle school and how this evolution varied by race. In order to undertake this comparison, we classify students into high-performing and low-performing cohorts based on their third grade performance.
An important consideration here is to avoid bias resulting from mean reversion and initial differences in the distributions of high- and low-performing students across various races. Following Reardon (2008) and Hanushek and Rivkin (2006), our analysis groups students into quartiles based on third grade mathematics scores for tracking the changes in ELA achievement between third and eighth grades. The same method is employed for tracking changes in the magnitude of the racial gap in mathematics.19 Students scoring in the lowest quartile in third grade are henceforth referred to as low-performing students, regardless of how they perform in subsequent tests. Conversely, students scoring in the highest quartile in the third grade are referred to as high-performing, regardless of their performance in eighth grade.
Trends in ELA Achievement. The racial trends in ELA achievement for initially low-performing students across elementary and middle school grades (Table 9, Panel A) are mostly similar to the averages across all students shown in the preceding section (Table 8). Initially low-performing white students saw little change in their relative ranking. In contrast to the average Hispanic student, Hispanic low-performers maintained their relative standing. Low-performing Asian students demonstrated significant progress while low-performing black students fell even further behind.
There were differences in achievement growth by gender. As was the case with average z-scores for all students reported in Table 8, low-performing female students lost less ground relative to their low-performing male peers. Among black low-performers, the deterioration in performance was much larger for male students compared with females; among both white and Hispanic low-performers a small decline in performance by males was offset by positive gains for female students. Among Asian low-performers, though there were gains both by males and females, improvement was much larger for the latter.
As was true among all students and among initially low-performing students, there exists significant variation in ELA test scores by race among initially high-performing students. While white high-performing students suffered modest relative declines, the deterioration in relative performance was sharpest among black high-performers, followed by Hispanic high-performers. As in other cases, Asian high-performing students registered a steep rise in test scores. There were again considerable differences by gender: among white high-performers, a small change for female students was contemporaneous with a larger decline among their male peers. Among both black and Hispanic high-performers, the extent of relative decline in performance was almost twice as high for male students as it was for females. Among high-performing Asian students, females gained more than their male counterparts.
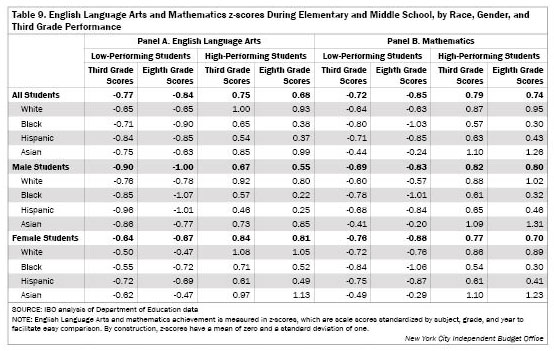
Trends in Math Achievement. Results for mathematics performance by initially low-performing students of various races (Table 9, panel B) closely track the patterns in ELA performance (Table 9, panel A), as well as the averages for all students (Table 8). White students maintained their relative standing, while Asian students again showed significant gains. Low performing black students, along with low-performing Hispanic students, lost even more ground. In particular, black students who initially lagged behind other racial groups were also the ones to fall back furthest.
Looking at achievement in terms of gender and race, modest relative gains by white males, combined with small losses by white females, further increased the white gender gap in math. Asian male and female students progressed at the same rate and the existing modest gender gap, in favor of male students, remained unchanged. Gender gaps for black and Hispanic students also remained roughly unchanged, with test scores of low-performing male and female students declining at about the same rate.
The results for initially high-performing students in mathematics are similar to the average results for all students, and to the trends among initially low-performing students. Asian and white students not only maintained their edge but widened it as black and Hispanic students lagged behind and racial gaps widened. High-performing black students lost the most ground, as was the case with the average black student and the low-performing black student. Disaggregating by gender, high-performing white male students progressed at a faster rate than their female counterparts, so that the small gender gap in third grade widened by the seventh grade. The same is true for Asian male and female students, though the gender gap among Asian students at seventh grade was much less compared with that for white students. Among black high-performing students, however, female students outperformed males, closing the gender gap that existed at third grade. Hispanic male and female high-performing students progressed at similar rates and the small gender gap was virtually unchanged from grades 3 to 7.
Changes in the Magnitude of Racial Achievement Gaps in ELA. Differences in the rate at which students progressed are reflected in changes in racial achievement gaps in ELA from grades 3 to 8 (Table 10). The gaps between white and black students widen, while a significant Asian-white gap emerges. The white-Hispanic gap was the highest ELA gap in third grade, but by eighth grade the white-black gap is larger than the white-Hispanic gap. The gaps for Hispanic students with respect to white students (and with respect to Asian students, not separately shown) increase by less compared with the gaps for black students. The black-Hispanic gap reverses, going from +0.09 to -0.04 in terms of changes in z-scores.
We find mostly similar changes in racial gaps across the sexes. Both the white-black gap and the Asian-white gap are larger for males than females, but the differences are small. The white-Hispanic gap is larger for females. Additionally, the existence of the overall black-Hispanic gap is entirely due to male students as black female students score on par with Hispanic female students in eighth grade ELA.
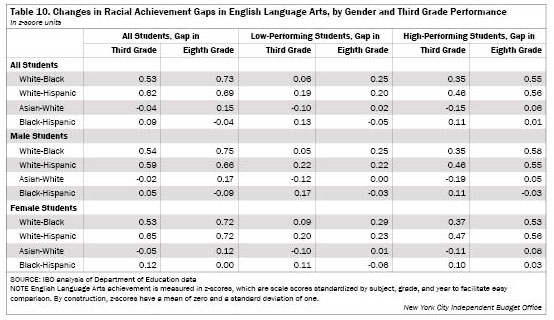
The gaps among initially low-performing students generally followed the same patterns. The white-black gap widened by a large margin. But unlike the case for all students, the white-Hispanic gap remained unchanged for the group of students who were low-performers in third grade. The Asian-white gap disappeared from third grade to eighth grade while the black-Hispanic gap also changed sign. There were mostly similar changes in the racial gap across genders. The white-black gap was higher for male than female students at both grades 3 and 8, although the differences are relatively small.
Achievement gaps in ELA among initially high-performing students evolved similarly, with some qualifications. The white-black gap, already large in third grade, widened further, as did the white-Hispanic gap. The Asian-white gap reversed direction, with the magnitude of the change bigger than among initially low-performing students. Hispanic high-performing students drew level with black high-performing students, after trailing them in third grade.
There was some variation by gender. The white-black gap widened more for male students. Black male high-performers lagged behind Hispanic male high-performers in eighth grade. But black female high-performers still maintained an advantage in ELA over their Hispanic counterparts, though the difference in eighth grade was much smaller than in third grade. The Asian-white gap in eighth grade among initially high-performing students is higher for female students.
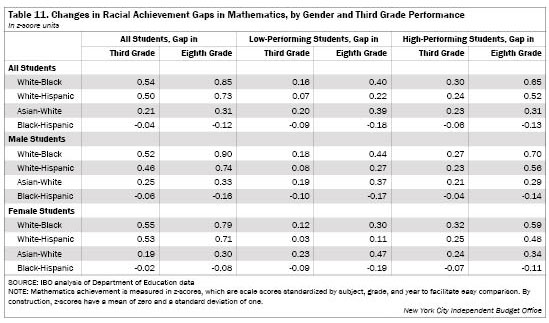
Changes in the Magnitude of Racial Achievement Gaps in Math. Each of the racial achievement gaps in mathematics widened from third grade to seventh grade (Table 11). There are large increases in both the white-black and white-Hispanic gaps. The white-black gap was already wider than the white-Hispanic gap in third grade, and it increased by a greater margin. In comparison, there were smaller increases in the Asian-white gap and the black-Hispanic gap, though these were still salient. The racial gaps in mathematics in seventh grade were similar to the corresponding gaps in ELA in eighth grade, though slightly larger in each case.
Broken down by gender, both the white-black gap and the white-Hispanic gap increased more for male students. The Asian-white gap increased more for females while the black-Hispanic gap widened more for male students, but the differences were small.
For students who were initially low performing, all racial gaps widened, in line with the overall averages. In both grades 3 and 7, the Asian-white gap in mathematics for low-performing students was almost as high as the corresponding white-black gap.
Looking at male and female students separately, the white-black and white-Hispanic gaps both increased more for male students, despite being already higher than those for female students. In contrast, the Asian-white gap and the black-Hispanic gap both increased more for female students, but the differences were smaller. The white-black gap in seventh grade was higher than the Asian-white gap among initially low-performing male students, but among initially low-performing female students, the Asian-white gap was much larger.
For high-performing students the white-black gap again increased the most, followed by the white-Hispanic gap. Increases in the Asian-white gap and the black-Hispanic gap were relatively small. For both the white-black gap and white-Hispanic gap, the widening of the gaps for male students was much larger than those for female students: while both gaps were smaller in third grade for male students compared with female students, by seventh grade, each was wider for male students. The Asian-white gap evolved similarly across male and female students, but the increase in the black-Hispanic gap was much larger among male students.
Using Regression Analysis to Track Changes in Achievement
As with the regression analysis on the correlates of achievement gaps in third grade, we conducted a regression analysis to explore the factors that might be associated with changes in achievement during elementary and middle school grades. The dependent variable is change in a student’s z-score from grades 3 to 8 (grades 3 and 7 for mathematics) or “achievement gains.” Separate but identical regressions were run for ELA and for math. We ran ordinary least squares regressions as well as fixed-effects regressions where the model includes a separate fixed effect for each middle school in the study (the latter are not separately reported for brevity).20 Other variables included in the regressions were:
- Dummy variables for individual races, white being the omitted category. The coefficients on these race dummies show if students from various races progressed at disparate rates through elementary and middle school grades.
- Individual student demographics (gender, poverty) and special education and ELL status. School peer composition (share of students from various races, share of students who are poor).
- The standard errors of the regression models are clustered at the school level to account for potential correlation among students attending the same school.
Regression Results: ELA. We found racial achievement gaps in ELA widened significantly during elementary and middle grades even when controlling for many individual and school-level factors (Table 12). Before controlling for these factors, the gap in ELA achievement between white and black students is seen to widen by 0.20 z-scores from grades 3 to 8. The respective numbers were 0.07 for Hispanic students and -0.19 for Asian students—both with respect to white students, the omitted category. As expected, these raw numbers mirror the change in the respective gaps shown in Table 10. The coefficient on the male dummy variable is highly statistically significant, signifying an important role of gender in the changes in achievement gaps. Note, however, that there is no evidence that this effect of male students varies across racial groups—the interaction terms (gender interacted with individual race dummies) are never statistically significant. Poverty status and special education status are both negatively and significantly related to changes in test scores from third grade to eighth grade.
The coefficients on the black and Hispanic dummy variables drop by half or more when school-level variables are incorporated in the model, suggesting considerable school-level differences in how achievement gaps develop across the years.21 The share of black students in a school was negatively related to achievement gains from grades 3 to 8, and the same is true for the share of students in poverty. Note, however, that these correlations by themselves do not indicate a causal negative impact on student performance of having more black students and more poor students in a school. These correlations, at least partly, reflect the concentration of minority and disadvantaged students in particular schools.
The results from models with school-level fixed effects are similar to the above findings. The coefficients on black and Hispanic dummy variables are reduced by half or more when we controlled for school fixed effects, similar to what happened with inclusion of school-level peer composition in OLS models. This suggests that achievement gaps widen by much less when we track students within individual schools. Still, there were large and statistically significant increases in achievement gaps even within schools.
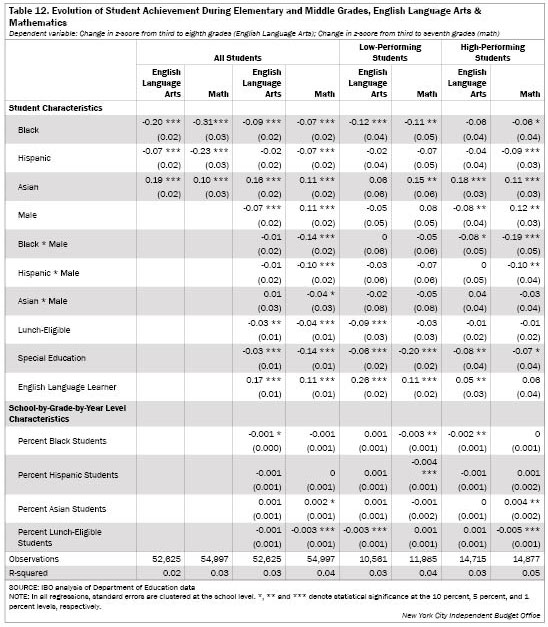
Regression Results: Math. As with the results for ELA, significant changes in racial achievement gaps in mathematics from third grade to seventh grade persisted when individual and school-level characteristics are controlled for (Table 12). With respect to white students, the omitted category, racial achievement gaps widened by 0.31 z-score units for black students and 0.23 z-score units for Hispanic students, mirroring the patterns in Table 11. Asian students improved significantly with respect to whites.
These changes in achievement gaps hold steady controlling for gender, poverty, and special education and ELL status. Unlike for ELA, the coefficient on the male dummy variable is positive overall and statistically significant. Both black male students and Hispanic male students significantly lag behind their female peers. As with ELA, poverty and special education status are negatively and significantly related to achievement gains. But in math the coefficient on special education is particularly large (in ELA, these two variables had similar estimated coefficients).
The magnitude of the coefficients on black and Hispanic dummies drops by half or more if we include school-level variables on peer composition, though the coefficient on Asian students is similar. The share of Asian students in a school is positively related to mathematics achievement gains from grades 3 to 7, but there is a negative association with respect to the share of students in poverty. The results are qualitatively similar among initially high-performing students and initially low-performing students. As for ELA, models for mathematics achievement incorporating school-level fixed effects yield similar findings. Despite a large reduction in the coefficients on black and Hispanic dummy variables when one includes school fixed effects, there remain large and statistically significant differences in achievement gains by race within schools.
Conclusions and Looking Ahead
Our report documents the presence of significant racial achievement gaps among third grade students in 2008-2009, which widened over time as students progressed through elementary school and then middle school. This was true in both reading and mathematics, and true if one looks at high-performing and low-performing students separately. Among other findings our research shows that these students in both elementary and middle schools were highly segregated, particularly by race, and that racial patterns in achievement gaps are mirrored in other school outcomes including grade retention, special education classification, and suspensions.
In addition to expanding the city’s pre-K program to provide free preschool to all 4-year olds, the de Blasio Administration has undertaken a variety of education initiatives including an expansion of after-school programs in middle schools; a community schools initiative that provides students with additional learning opportunities and enrichment programming; changes in the discipline code including abolition of suspensions for students in grades K-2; an expansion of school choice for enrollment in middle schools; and an increase in teacher pay. Simultaneously, the DOE has also moved away from performance-based accountability policies. An evaluation of the de Blasio Administration programs is beyond the scope of this paper, but many of these initiatives might be expected to affect student performance, particularly for students coming from minority and disadvantaged families.
Continued geographic clustering of students along racial, economic, and other dimensions has been an uninviting feature of the K-12 educational landscape in New York City. As recent news reports have highlighted, the issue of school segregation is fraught with considerable unease on all sides for parents, policymakers, and property owners. The DOE has recently launched a Diversity in Enrollment initiative, where it works with schools seeking to diversify their student populations; seven elementary schools were earlier allowed to implement diversity-based enrollment policies by putting aside a number of incoming seats for low-income students.22 The DOE has also been implementing a community school-district based middle school choice policy, which has the potential to weaken existing stratification.
There are other issues related to achievement gaps that we have not examined in this report, particularly as they relate to family socioeconomic status. One such indicator relates to homelessness. Recent work by IBO has not only found significant racial gaps in the share of students who are homeless or live in temporary housing but also documented how difficult living in temporary housing like shelters can be for the growth and development of young children.23 Thus, understanding how homelessness complicates the race and gender achievement gap would be illustrative. It would also be instructive to follow these students through high school years and beyond, which would allow for a fuller picture of educational attainment and college readiness.
Finally, it is important to note that we have only considered student differences in terms of performance on standardized tests, which are commonly believed to mostly reflect cognitive skills. An emerging literature in education highlights the important role of noncognitive skills in both educational and future life outcomes, and researchers are urging schools to nurture such skills. In addition to critical thinking skills and problem solving skills, noncognitive skills include emotional health, social skills, work ethic, self-control, persistence, academic confidence, teamwork, organizational skills, and communication skills (Garcia, 2014). At this juncture there is not a well-developed metrics system for assessing noncognitive skills, but their increasing importance is expected to lead soon to creation and development of appropriate instruments.
Prepared by Joydeep Roy
Endnotes
1Students (and their families) self-report their racial identity, which are then recorded by the New York City Department of Education and made available to researchers (without any identifying information). Note that as used by the DOE, blacks are non-Hispanic.
2The poverty indicator used in the study takes into account whether a student is eligible for free or reduced-price lunches, and whether he or she attends a school with a universal school meals program. Students in either of these categories are considered to be lunch-eligible.
3There were about 150 students with missing data on background including ethnicity. There were more students with missing scores on third grade ELA and/or mathematics tests, but overall the study sample includes 97 percent of third grade students in New York City public schools in 2008-2009.
4It is possible to disaggregate students in New York City public schools along additional dimensions, including home language and place of birth. This report studies how student performance and other school outcomes (suspensions, grade progressions, and attrition) differ by gender and race, and for purposes of tractability refrains from analyzing additional background characteristics. IBO’s annual school indicators reports describe the breakdown of public school students in terms of birth place and home language.
5See “How Many Students Attend Nonpublic K-12 Schools in New York City?” New York City Independent Budget Office, April 22, 2014.
6These numbers are derived from Table 3. For example, the black-white gap is obtained by subtracting the black mean z-score (-0.16) from the white mean z-score (0.45).
7As clustering only affects the standard errors and not the estimated coefficients, it has little impact on our results as most coefficients are highly statistically significant.
8Columns (3) and (4) also include, as additional explanatory variables, interactions of the male dummy with the race dummies. These help us to see if, for example, black male students are lagging behind white male students over and above that by which black females are lagging behind white females.
9The gender and race interaction terms show if male students from individual races are lagging behind white male students over and above that by which their female peers from the same race are lagging behind white female students. (Because of the inclusion of a gender dummy [male] and individual race dummies [black, Hispanic, Asian] in this model, the reference category is white female students.) For example, in column (3) the coefficient on black is -0.30, the coefficient on male is -0.15 and the coefficient on black * male is -0.04. This implies that the average black female student scored 0.30 z-units lower than the average white female student, controlling for other factors, while the average black male student scored 0.49 (0.30+0.15+0.04) z-units lower than the average white female student; 0.34 (0.30+0.04) z-units lower than the average white male student; and 0.19 (0.15+0.04) z-units lower than the average black female student.
10See “ A Look at New York City’s Public High School Choice Process,” New York City Independent Budget Office Schools Brief, October 2016.
11Grade repetition is mostly concentrated among low-performing students, being very small for high-performing students. So we do not separately report the figures for high-performing students. Note also that a large share of grade repeaters was comprised of special education students. Here also we found significant differences across the races. A much higher share of white and Asian grade repeaters were special education students compared with black and Hispanic grade repeaters.
12The special education population is very heterogeneous with respect to the type of disability and mandated services. This remains true when students are disaggregated by gender, race, and initial performance.
13See Table 3. Some of these detailed breakdowns are not reported for brevity.
14For completeness and a check on the robustness of the results, we also conducted parallel analyses where all students with available test scores in that year were included in the sample, irrespective of their future enrollment and test-taking status. For example, this sample would include for 2010-2011 every student from the original cohort who reported a fifth grade test score in that year. The number of students in the sample decreases from year to year, as some of the cohort leaves the city’s public schools. Note that students joining the cohort in subsequent years are not added to the sample because we lack test score data from third grade for these late joiners and hence have to exclude them from the analysis.
15The state tests changed considerably in 2013-2014 due to alignment with Common Core standards, which could affect the eighth grade test scores in 2013-2014. Note, however, that this report focuses on relative achievement gaps and thus the potential for large bias is minimal.
16As a validity check, we repeated our analysis with mathematics test scores from the eighth grade. The results are qualitatively similar. These results are not reported.
17Technically, when we are looking at the distribution of all students there should be exactly 25 percent of them at the 25th percentile cutoff (and similarly for other cutoffs). But in reality scale scores, both in ELA and mathematics, are discrete, despite having a wide range. Since we assigned the same percentile rank to students who registered the same performance in terms of scale scores, there are small deviations. For example, 26 percent of third graders scored at the 25th percentile threshold in ELA, and 48 percent scored at the 50th percentile threshold.
18The numbers in this table pertain to students who remained in New York City public schools throughout the period under study and progressed a grade each year. The group of students who left or were repeating a grade were more likely to be relatively low-performing, and this accounts for the slight advantage in third grade performance compared with eighth grade performance.
19A lucid and more elaborate explanation of the methodology can be found in Hanushek and Rivkin (2006). Intuitively, students whose test scores are currently low are more likely to see positive mean-reversion in future test scores in the same subject compared with students whose test scores are currently high. By extension, it follows that if students from one racial group are more likely to be initially low-performing in a particular subject compared with students from another racial group, classification based on performance in that same subject will underestimate the growth in racial achievement gaps.
20The school fixed effect relates to the school attended at the time of the eighth grade tests (seventh grade for mathematics). Intuitively, FE regressions control for differences across schools that affect students from various races similarly (resources, school staff, building conditions, etc.).
21Note that mere bunching of achievement gaps at the school level does not by itself point us to potential causes and remedies. Given the considerable segregation of students within New York City public schools as documented above, it is difficult to ascertain if this association is causal in nature or just reflects the fact that many low-performing students, particularly students of color, are concentrated in particular schools.
22See Amy Zimmer, 7 Elementary Schools Will Try to Boost Student Diversity in Pilot Program, dnainfo, November 20, 2015.
23See Independent Budget Office (2016). Not Reaching the Door: Homeless Students Face Many Hurdles on the Way to School. October 2016.
References
Carneiro, P., Heckman, J. J., & Masterov, D. V. (2003). Labor market discrimination and racial differences in premarket factors. NBER Working Paper 10068, 2003, Cambridge, MA: National Bureau of Economic Research.
Chetty, Raj, John N. Friedman and Jonah E. Rockoff (2014). Measuring the Impacts of Teachers II: Teacher Value-Added and Student Outcomes in Adulthood. American Economic Review, vol. 104, no. 9, September 2014, pp. 2633-79.
Garcia, Emma (2014). The Need to Address Noncognitive Skills in the Education Policy Agenda. EPI Briefing Paper 386, Economic Policy Institute, Washington DC, http://www.epi.org/publication/the-need-to-address-noncognitive-skills-in-the-education-policy-agenda/
Hanushek, Eric A. and Steven G. Rivkin (2006). The Evolution of the Black-White Achievement Gap in Elementary and Middle Schools. Paper presented at American Economic Association Annual Meetings, Boston, MA, January 6-8, 2006, https://www.aeaweb.org/assa/2006/0108_1300_0802.pdf
Heckman, J. J., & Vytlacil, E. (2001). Identifying the role of cognitive ability in explaining the level of and change in the return to schooling. Review of Economics and Statistics, 83(1), 1-12.
Kuscera, John. New York State’s Extreme School Segregation: Inequality, Inaction and a Damaged Future. The Civil Rights Project, University of California, Los Angeles March 2014
Lin, Dajun, Randall Lutter and Christopher J. Ruhm (2016). Cognitive Performance and Labor Market Outcomes. NBER Working Paper 22470, http://www.nber.org/papers/w22470.
Neal, D. A., & Johnson, W. R. (1996). The role of premarket factors in black-white wage differences. The Journal of Political Economy, 104(5), 869-895.
Reardon, Sean (2008). Differential Growth in the Black-White Achievement Gap During Elementary School Among Initially High- and Low-Scoring Students. Stanford University, Institute for Research on Education Policy and Practice, Working Paper# 2008-07.
Reardon, Sean F., Joseph Robinson-Cimpian, and Ericka Weathers (2016). Patterns and Trends in Racial/Ethnic and Socioeconomic Academic Achievement Gaps. In Handbook of Research in Education Finance and Policy, Helen Ladd & Margaret Goertz (Eds.), Lawrence Erlbaum.
Stiefel, Leanna, Amy Ellen Schwartz and Ingrid Gould Ellen (2006). Disentangling the Racial Test Score Gap: Probing the Evidence in a Large Urban School District. Journal of Policy Analysis and Management, 2006, Vol. 26, No. 1, 7–30.
PDF version available here.
Receive notification of free reports by e-mail