
Independent Budget Office
May 15, 1999
Analysis of the Mayorĺs Executive Budget for 2000
As required by Section 252 of the New York City Charter, IBO has prepared this analysis of the Mayorĺs executive budget for 2000. Earlier this year, IBO issued reports on New York Cityĺs long-term fiscal outlook as well as on the Mayorĺs preliminary budget for 2000 and financial plan through 2003. This report updates our forecast of the cityĺs economic and fiscal outlook in light of the recently released executive budget and revised financial plan.
I
. OverviewThe Independent Budget Office (IBO) projects fiscal year 1999 will close with a surplus of about $2.1 billionŚthe third consecutive year that the surplus has exceeded $1 billion. Fiscal year 1997 closed with a surplus of $1.4 billion, followed by $2.1 billion in 1998. These surpluses are primarily attributable to the fact that local tax revenues have been generated at a far greater rate than the city anticipated at the start of each year, in large part as a result of the continuing record profitability of Wall Street securities firms.
As in the past, the Mayorĺs executive budget proposes to use the lionĺs share of the surplus to balance the budget for the upcoming yearŚalthough some funds are targeted to reduce a budget gap expected in 2001. From an accounting perspective, this is accomplished by using surplus funds to prepay debt service costs otherwise payable in the subsequent year, thereby in effect allowing a given yearĺs surplus to be "rolled" forward into the ensuing fiscal year. The Mayor proposes to use nearly the entire current surplus to prepay debt service costs otherwise payable in 2000, and earmark $429 million of the resulting 2000 debt service savings for prepayment of debt service presently scheduled for payment in 2001.
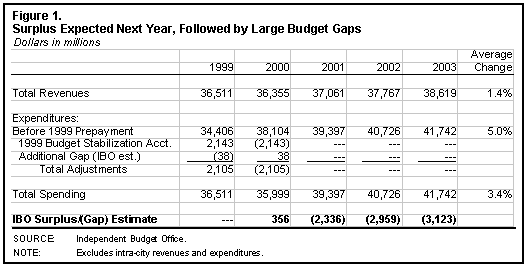
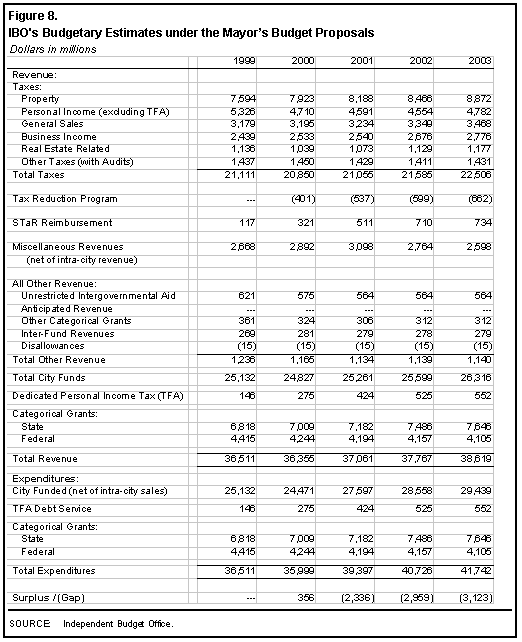
Figure 1 shows IBOĺs projected surpluses and gaps for 2000 through 2003 under the Mayorĺs executive budget and financial plan. Our projections assume adoption of the Mayorĺs proposal to spend nearly all 1999 surplus funds to reduce debt service costs presently scheduled to be paid next year. However, for illustrative purposes, we depart from the executive budget by assuming that the Mayorĺs $429 million debt service prepayment for 2001 will not occur. This assumption on our part, along with our projection that revenues next year would outpace expenditures results in a projected surplus of $356 million in the coming year, followed by a gap of $2.3 billion in 2001.
Beyond 2001, we project budget gaps of $3.0 billion and $3.1 billion in 2002 and 2003, significantly larger than those projected in the Mayorĺs financial plan. IBOĺs gap estimates result from our assumption that expenditures will grow at a substantially faster pace than revenues beyond 2000.
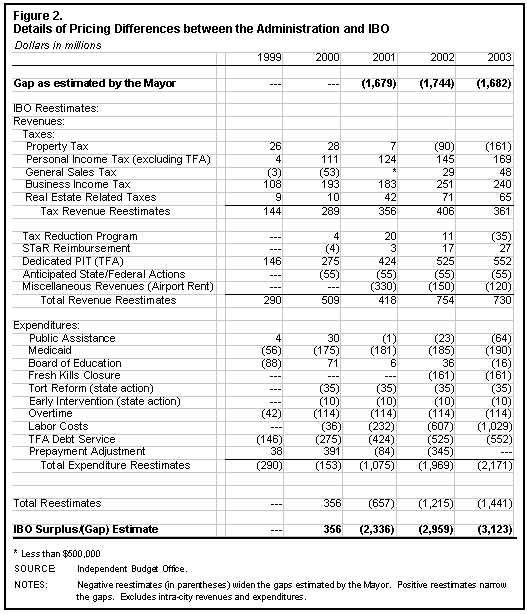
In contrast, as shown in Figure 2, the Mayor projects a balanced budget in 2000 and a shortfall of $1.7 billion in 2001. If, however, the Mayorĺs budget employed a similar approach to IBOĺs regarding prepayments beyond 1999, the executive budget would show a surplus of $429 million for next year followed by a gap of $2.1 billion in 2001.
While the strength of the local economy is helping the city solve many of its near-term budget problems, persistently large projected out-year gaps remain a major concern for the cityĺs fiscal well-being. The danger facing the city today is that even a modest slackening of the still robust growth forecast for the next four years could quickly push projected out-year budget gap percentages back up to the double-digit levels of the early 1990s.
Although the city has made great strides over the past decade in improving the quality of life through substantial reductions in crime, lower taxes, and an improved business climate, little has been done to address the cityĺs long-term fiscal challenges. Budgetary pressures will persist well into the next decade, driven in large part by rising labor costs, debt service consuming an ever larger share of the operating budget, and the need to improve city schools. Moreover, none of the billions of dollars in surplus funds generated over the past three years have been used to help bring the city into structural budget balance.
Steps could be taken now to alleviate budgetary problems in the years ahead. For example, surplus funds could be used to finance some projects on a pay-as-you-go basis, thereby reducing future borrowing needs. Alternatively, the surplus funds could be spread over the entire financial plan period and beyond by reducing outstanding debt to help fortify the city's long-term fiscal position. Additionally, a true rainy day fund could be established for use in the event of an economic or fiscal downturn. While it has been argued that the establishment of such a fund would require state legislation, a rainy day fund could be created at the local level by simply having a local law (or other agreement) requiring that the cityĺs current budget stabilization account be re-appropriated each year in an amount equal to its year-end balance.
II. Revenue Estimates
In the current fiscal year, IBO estimates that city revenues from all sources will total $36.5 billion, a robust 4.6 percent increase from 1998, and nearly $400 million above the executive budget forecast. For 2000, however, IBO forecasts a slight (-0.4 percent) downturn in city revenues, to $36.4 billionŚstill $1 billion more than the forecast by the Mayorĺs Office of Management and Budget (OMB). IBO expects revenue growth to resume again in 2001, averaging 2.1 percent annually, with total revenues reaching $38.6 billion by 2003. The forecast includes IBOĺs projected changes in the growth of baseline (current policy) revenues plus our estimates of the impact of the proposed tax reduction program.
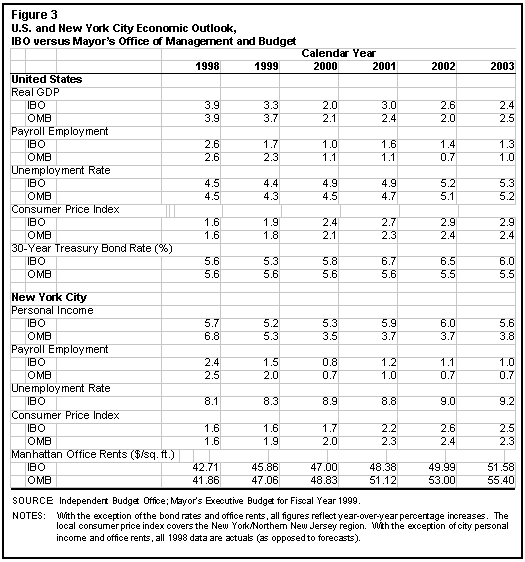
Much of the decline in fiscal year 2000 revenues forecast by both IBO and OMB can be attributed to an anticipated slowdown in economic growth in calendar years 1999 and 2000 (see Figure 3). IBO expects economic growth to pick up beginning in 2002, while OMB projects continued flat growth. As a result, IBOĺs out-year forecast shows revenues growing more rapidly, so that by 2003 our total revenue forecast is more than $1.8 billion higher than the Administrationĺs forecast.
Baseline Revenue Forecast
With the local economy adding another 68,000 jobs over the past year, New York Cityĺs tax revenues have continued to grow and by the end of fiscal year 1999 will total $21.3 billion, including $146 million in personal income tax (PIT) revenues that are dedicated to the Transitional Finance Authority (TFA).1 The 4.1 percent rate of growth of tax revenues in 1999 is not likely to be matched in the near future. Slower economic growth in the near-term, expiration of a 12.5 percent PIT surcharge, less robust Wall Street profits, already enacted tax cuts, and new tax reduction initiatives will all contribute to a 2.5 percent decline in tax revenues in 2000. Growth resumes and steadily accelerates in the later years of the forecast, and projected city tax revenues, including dedicated TFA revenues, reach $22.4 billion in 2003.
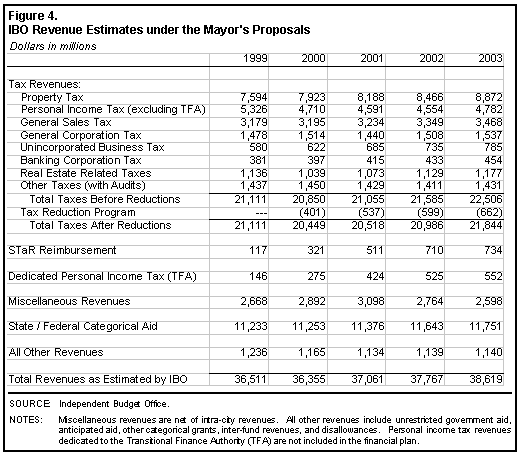
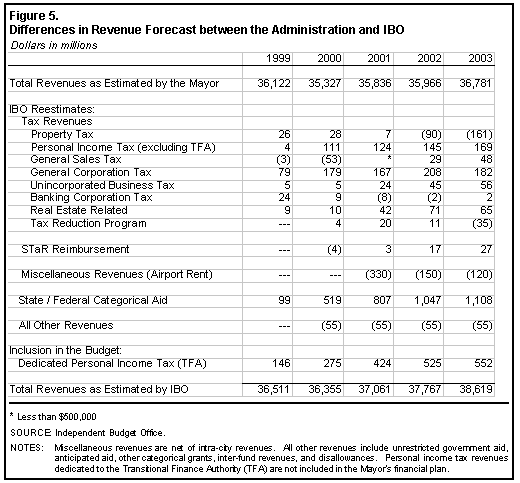
Figures 4 and 5 summarize IBOĺs reestimate of the executive budget revenues and the differences between the OMB and IBO forecasts, respectively.
Property Taxes. IBO projects that property tax collections will grow by 4.3 percent in 2000. However, over half of the growth is attributable to the scheduled expiration of the coop/condo tax abatement. Because the property tax law phases in commercial and residential apartment building assessment increases over five years, property tax revenues lag improvements in real estate markets. Hence, market gains since the mid-1990s are only now beginning to be reflected in the assessment and revenue forecasts. Assessed values for most types of property are expected to show continued improvement, with the strongest growth coming in apartment buildings, particularly Manhattan rentals. As a result, property tax revenues will continue to grow at a strong 4 percent annually from 2001 to 2003.
Two other real estate-related taxesŚthe mortgage recording and real property transfer taxesŚafter experiencing phenomenal growth in 1999, are both projected to decline in 2000, although to levels still significantly above their recent pasts. While the strong economy and low interest rates have spurred growth in the number and value of residential transactions, most of the increased revenue in 1999 is due to extraordinary activity in the commercial sector. IBOĺs forecast assumes that the number and value of transfers and mortgages remain higher than OMB projects, but return to growth rates consistent with historical trends. For 2000, revenues from both taxes combined are expected to fall by 12.8 percent and then resume growing at an annual rate of 4.7 percent through 2003.
Personal Income Tax. The strong growth in personal income continues to fuel personal income tax (PIT) collections. By the end of the current fiscal year, PIT receipts (including receipts dedicated to the Transitional Finance Authority) will grow 6.6 percent over 1998, to $5.5 billion. This growth is particularly impressive given the phase in of the School Tax Relief (STaR) credit and expiration of a 12.5 percent PIT surcharge this year.2
In 2000, however, the full brunt of surcharge elimination, the next phase of STaRĺs PIT cuts, slower local economic growth, and more moderate revenue growth in the securities industry will all lead to a significant reduction in PIT receipts to just under $5 billion. Even so, the IBO forecast exceeds OMBĺs by $111 million, with most of the difference attributable to a higher estimate of capital gains and self-employment income. From 2001 to 2003, IBO projects PIT revenues will increase from $5.0 billion to $5.3 billion with average annual growth equaling 3.1 percentŚcompared to OMBĺs 2.8 percentŚdue to IBOĺs forecast for greater personal income and employment growth, and higher securities industry profits.
General Sales Tax. Despite the continued surge in income and earnings generated by the New York City economy, sales tax collections for the past two quarters grew at a relatively weak year-over-year rate of 2.5 percentŚjust slightly above the rate of inflation. As a result, projected total collections for fiscal year 1999 have been reduced by $48 million from IBOĺs March forecast. Our baseline sales tax revenue forecast for fiscal year 2000 is almost unchanged from March, with stronger projected growth in indicators of household, business, and tourist expenditures just offsetting the drag produced by the recent collections growth slowdown.
IBOĺs 2000 forecast is $53 million lower than OMBĺs forecast. Most of the gap is due to differences in estimating the baselined cost of the exemption for clothing items costing less than $110, proposed to take effect on December 1, 1999. IBO expects sales tax revenue growth to moderateŚbut continue to outpace inflationŚin 2001 and beyond, in line with the projected slackening pace of the cityĺs overall economic expansion.
Business Taxes. IBO projects that the cityĺs three taxes on business net incomeŚthe general corporation tax (GCT), the unincorporated business tax (UBT), and the banking corporation tax (BCT)Śtogether will bring in $2.4 billion in 1999 and $2.5 billion in 2000.
Slower economic growth, including stagnant U.S. corporate profits, will dampen GCT collections in 2000 and 2001. Changes to the GCT enacted in 1997 will also reduce revenues by $118 million in 1999 and $151 million in 2000 and by increasing amounts thereafter. Despite these changes, the economic rebound beginning in 2001, when corporate profits are forecast to increase 5.5 percent, will cause overall GCT revenues to begin to rise again in fiscal year 2002.
From 1995 to 1998, unincorporated business tax collections grew 77 percentŚa particularly impressive amount given a number of tax cuts enacted during the period. Because of financial sector losses in mid- to late-1998, IBO projects that UBT receipts will grow 7.2 percent to $622 million in 2000. This more moderate growth rate should continue from 2001 to 2003, when UBT collections are expected to increase at an average annual rate of 8.1 percent, reaching $785 million by 2003. IBO foresees faster growth in the local economy and in securities firmsĺ profits than does OMB, with the result that IBOĺs forecast for 2001 through 2003 exceeds OMBĺs by a cumulative $125 million.
Following an increase of 42.8 percent in 1998, IBO expects banking corporation tax revenues to experience a sharp decline in 1999, with revenues forecast to fall 26.0 percent to $381 million. Annual increases of between 4 and 5 percent are expected over the forecast period with revenues reaching $397 million in 2000 and $454 million in 2003. The uniformly rising forecast for the next four years is a result of the steady growth in bank earnings forecast for 1999 and beyond. IBOĺs forecast is consistent with that of the executive budget.
Tax Reduction Program
Coop/Condo Abatement
The tax programs in both the Mayorĺs executive budget and the City Councilĺs preliminary budget response call for extending the existing coop/condo property tax abatement, which expires at the end of this fiscal year. Designed to reduce the disparity in tax burdens between owners of cooperative and condominium apartments and owners of one-, two-, and three-family homes, the abatement is costing the city $159 million in 1999. The Mayor proposes to extend the abatement at its current level for four more years. IBO estimates that the cost would grow to $171 million in 2000 and $207 million by 2003. These estimates, which are somewhat higher than those given in the preliminary budget, take into account IBOĺs forecast of assessment growth for these properties and a gradual increase in the number of qualifying properties. The Council proposes not only to extend the program for four years but also to increase the value of the abatement beginning in 2001. IBO estimates that the Councilĺs proposal would increase the cost of the program to $231 million in 2001 and $294 million by 2003.
Background. The cityĺs property tax system has four tax classes, with different assessment procedures and tax rates for each class. Most coop and condo apartment buildings in the city are assigned to tax class 2 for property tax purposes, while one-, two-, and three-family homes are designated as tax class 1. For 1999, the cityĺs average effective tax rate (property tax as a percentage of market value) for class 1 houses is 0.74. In contrast, average effective tax rates for most coops and condos are 1.18 and 1.44, respectively, both significantly higher than the class 1 rate.3
Advocates for coop and condo owners have long contended that the city should treat all homeowners equally, regardless of whether they live in apartment buildings or houses. In 1996, legislation was enacted to create a temporary three-year abatement to narrow the gap in effective rates. For 1999, the abatement reduces taxes on qualifying apartments by 17.5 percent.4 The abatement was instituted as a stopgap measure to provide some relief while the city developed a long-term solution to eliminate the difference in tax burdens faced by apartment owners and class 1 homeowners. The law included a requirement that the city deliver such a plan by December 1996, which it has not yet done. In the absence of such a plan, the Mayor proposes to extend the abatement at the current level for four more years. As noted earlier, the Council would not only extend it but would also increase the abatement to 22.5 percent for 2001 and 25.25 percent for 2002 and 2003.5
Abatement Shortcomings. Extending the current abatement for four years may have consequences that are undesirable from the perspective of sound tax policy. First, there are serious problems with the current abatement itself that would not be addressed by simply extending it in its present form. IBOĺs December 1998 study found that the abatement does a poor job of targeting benefits to the buildings with the greatest need. Effective tax rates on coops and condosŚand hence the gap between class 1 tax burdens and the burdens on apartment ownersŚvary greatly across the city. These differences stem from distortions in the assessment process that cannot be equalized by an abatement that reduces tax bills by the same percentage for all owners. The areas of the city receiving the largest reductions in the class 1 gap (the difference between the effective rate for coops and condos and the class 1 effective rate) are those with the smallest gaps to begin with, and the least need for relief.
Second, the current abatement is inefficient, with $29 million (18 percent) of the benefits going to apartment owners who either already had tax burdens below the class 1 level before the abatement, or who needed only a portion of their abatement to reach the class 1 level. This inefficiency could be mitigated by reducing or eliminating the abatement for some apartments based on such criteria as value or location. Neither the Mayor nor the Council proposes any changes that would address this problem.
Indeed, by increasing the abatement percentage without altering the program to ensure that a beneficiary needs any further benefitŚor any benefit at allŚto reach the class 1 tax level, the Councilĺs proposal will make the program even less efficient. IBO estimates that the Councilĺs proposal would increase the amount of unnecessary benefits (beyond what is needed to produce the equivalent of the class 1 tax burden) to $48 million in 2001 and $64 million by 2003.
Finally, extending the abatement for four years postpones the promised reform that would give all apartment owners the full benefits of class 1 treatment. Although there are important implementation issues to be resolved, the outlines of a long-term solution are clear. Coops and condos would be assessed and taxed using sales based market values subject to the same protections enjoyed by class 1 property owners. Such reform would eliminate the differences in effective rates among apartment owners, and all coops and condos with tax burdens above the class 1 level would have their taxes brought down to that level. The largest reduction in tax burdensŚin percentage termsŚwould be concentrated in the areas of the city that now have the largest class 1 gaps. Moreover, it would cost about the same to completely eliminate the gap (assuming owners with burdens already below class 1 are held harmless), as to implement the Councilĺs proposal.
Commercial Rent Tax Cut
Both the Mayor and the City Council include commercial rent tax (CRT) cuts in their tax programs. The Mayorĺs executive budget calls for phasing in a 26 percent reduction in the effective tax rate, while the Councilĺs alternative tax program, presented in its response to the preliminary budget, calls for eliminating the tax entirely over three years. The cost to the city under the Mayorĺs plan would be $22 million in 2000 and would grow to $89 million in 2003. The Councilĺs plan would cut revenue in 2000 by $116 million and by $424 million in 2003.
Background. The CRT is paid by commercial tenants based on the amount of rent they pay to their landlords. Tax liability is determined by a single flat rate applied to the base rent. A sliding-scale credit which phases out as taxable rent increases helps to moderate what would otherwise be a steep rise in the marginal tax paid on rents just over the zero liability threshold.
Although the CRT tax burden has been lowered several times since its peak in 1977, in the last four years the city has made much more dramatic changes, significantly reducing both the number of firms subject to the tax and the liability of the remaining taxpayers. Since September 1995, only leases in buildings south of 96th Street in Manhattan are subject to the tax, and since June 1997, only tenants with base rents above $100,000 have any tax liability.
For tenants still subject to the tax, the most important change has been a reduction in the effective tax rate, which has fallen from 6 percent to 3.9 percent. The cumulative value in 1999 of the cuts enacted since 1995 is $364 million. These reductions account for the precipitous fall in CRT revenues (excluding audits) from $629 million in 1994 to $344 million in 1999; without the cuts, CRT revenue would be $708 million this year.
These enacted changes have greatly reduced the number of CRT taxpayers while increasing the share of large firms still paying the tax. Nevertheless, tenants with relatively modest rents still account for the majority of remaining taxpayers. Based on rent distributions supplied by the Department of Finance, IBO estimates that 76 percent of the remaining taxpayers have annual rents of $400,000 or less, paying an average rent of nearly $200,000. For illustrative purposes, consider that $200,000 in rent would pay for roughly 8,000 square feet of office space at $25 per square foot, or 2,700 square feet of retail space at $75 per foot.
New Yorkĺs tax on commercial occupancies is unique and is often cited as evidence of the cityĺs high tax burdens on businesses and an impediment to economic development. The critical view of the tax fails to account for the extent to which the true burden falls not on tenants but rather on the landlords whoŚdepending on market conditionsŚmay be compelled to charge lower rents in order to compete with landlords in localities without such a tax. To the extent the burden is shifted, the CRTĺs negative effect on economic development is reduced. Moreover, the CRT serves a useful role in the cityĺs tax structure because of its capacity to capture growth in commercial property markets before it is reflected in property tax revenues.6
The CRT and stadium financing. The CRT has been linked to the Mayorĺs attempts to finance the cityĺs share of the cost of building new professional sports facilities since the 1999 executive budget was released last April. At that time, the Mayor scaled back a proposal he had made in his preliminary budget to gradually phase-out the CRT between 2000 and 2002. Rather than eliminating the tax he proposed to reduce the effective CRT rate to 3 percent; this is the same proposal included in this yearĺs executive budget.
In last yearĺs executive budget, the money saved by not moving towards full elimination of the CRT would have been taken off-budget and dedicated to a new Sports Facility Corporation. In contrast, this yearĺs budget severs the link between the tax and stadiums. The CRT revenue remaining after his proposed effective rate cut would be treated like all other revenues and flow into the general fund. The amount budgeted for the Sports Facility Corporation would be simple appropriations from the same general fund.7
The Mayorĺs proposal. The executive budget calls for reducing the effective tax rate on the CRT to 3.4 percent in December 1999 and then to 3.0 percent in June 2001. The effective rate would be lowered by discounting the amount of base rent subject to tax. The estimated costs of these reductions are $22 million in 2000, $46 million in 2001, and $89 million in 2003.8 The CRT owed by a firm paying $200,000 a year in rent would fall from $7,800 in 1999 to $6,000 in 2002. Although reducing the effective rate benefits all taxpayers, the dollar value is concentrated at the higher end, with 69 percent of the benefit flowing to taxpayers with annual rents of $1 million or more.
The City Councilĺs proposal. The Councilĺs response to the preliminary budget calls for eliminating the CRT entirely by 2002. This proposal follows the plan laid out in the Mayorĺs 1999 preliminary budget. The effective rate would be cut to 2.6 for 2000, 1.3 for 2001, and finally zero in 2002. This change would reduce city revenues by $116 million in 2000, $260 million in 2001, $409 million in 2002, and $424 million in 2003.
Mortgage Recording Tax Cut
The Mayorĺs executive budget and the Councilĺs response to the preliminary budget both contain proposals to reduce the mortgage recording tax (MRT) for most first-time homebuyers. The Mayor would cut the tax in half on mortgages used to finance the purchase of homes selling for $250,000 or less, at a cost to the city of $4 million in 2000 (the change would not take effect until January 2000) and $9 million by 2003. The Council calls for completely eliminating the tax for first-time buyers purchasing homes valued at $250,000 or less, with smaller reductions for homes selling at prices up to $350,000. IBO estimates that the Councilĺs option would lower city revenues by $18 million in 2000 (assuming it is in effect for the full year) and $20 million by 2003.
Background. The city MRT is actually a combination of two taxes, one levied by the city itself, and a second one levied by the state with a portion of the revenues going directly to the city. The taxes are charged on mortgages used to finance the purchase of real property; the combined rate varies depending on the size of the mortgage and the type of property. Loans used to finance the purchase of cooperative apartments are exempt from the tax. Combined with the cityĺs portion of the state tax, the city rates are 1.5 percent for all mortgages up to $500,000, 1.625 percent for larger residential mortgages, and 2.25 percent for large commercial mortgages.
The Mayorĺs proposal. The plan presented in the executive budget would cut the combined city rate from 1.5 percent to 0.75 percent for first-time homebuyers spending $250,000 or less. The Administration estimates that the tax cut would provide average savings of approximately $900 for 31,000 purchasers each year. IBOĺs analysis of the limited data available on first-time homebuyers indicates that there would be only 7,600 beneficiaries per year who would realize average savings of $1,130 under the Mayorĺs proposal. These very different assumptions account for the significant gap between OMBĺs estimated cost of the program ($28 million in 2003) and IBOĺs estimate ($9 million in 2003).
The City Councilĺs proposal. The Councilĺs response to the preliminary budget includes a proposal to eliminate the entire city portion of the MRT for first-time buyers of homes purchased for up to $250,000. The combined city rate for houses purchased from $250,000 to $300,000 would be reduced to 0.5 percent, while buyers of houses purchased from $300,000 to $350,000 would pay a combined city rate of 1 percent. IBO estimates that under the Councilĺs plan nearly 8,700 first-time homebuyers would benefit each year, with average savings of $2,130.
Both plans would require state legislation to amend the law governing the cityĺs MRT levy. However, because the Councilĺs proposal would alter the city portion of the stateĺs tax, state legislation would also be needed to adjust the stateĺs MRT law.
Sales Tax Program
The Mayorĺs proposed tax program for 2000 includes three sales tax cut items: extension of the clothing sales exemption (now scheduled to cover items costing less than $110) to all clothing sales; extension of the book sales exemption (now covering college texts) to all book sales; and halving the city sales tax rate on building materials and construction services from 4 percent to 2 percent.
Clothing. Legislation has been enacted in Albany to eliminate the state sales tax on clothing and footwear items priced under $110 starting December 1, 1999 and permits localities to follow suit. Although the City Council still has to approve city participation in the exemption, final approval is expected and the city sales tax reduction has been incorporated into the baseline revenue projections in the executive budget. In addition, the executive budget contains a proposal to eliminate the city sales tax on all remaining ($110 and over) clothing and footwear sales, also effective December 1st.
IBO anticipates substantial deferments of clothing purchases in the weeks leading up to the start date of both the pending and proposed clothing tax exemptions. Consequently, IBOĺs cost estimates for both the under-$110 exemption ($164 million) and the proposed additional exemption ($61 million) are substantially higher than the executive budgetĺs cost estimates for 2000. In 2001 and after, IBOĺs forecast of clothing tax exemption costs is close to that of the financial plan.
While the cityĺs projection of tax program costs does not incorporate secondary revenue gains from impacts on economic growth, the potential for significant secondary gains has been an important part of arguments for clothing tax cuts. IBO addressed this issue in a June 1997 fiscal brief, Would Clothing Sales Tax Cuts Pay for Themselves?
We estimate that after the final enabling legislation is passed, the elimination of all city and state taxes and surcharges on under-$110 clothing sales will boost New York City clothing sales by approximately $700 million a year, leading to an overall increase of about 7,200 private sector jobs in the city economy.9 The new economic activity spurred by the tax cuts will be accompanied by increases in other city tax revenues. These increases will be small at first, but when all the secondary city tax revenue impacts are phased in, they will offset about 15 percent of the cityĺs under-$110 clothing tax revenue loss.
In the case of the proposed additional clothing tax exemption, it appears unlikely that the city exemption, if approved, would be accompanied by a state sales tax exemption. IBO estimates that a stand-alone city sales tax exemption for $110-and-over clothing items would generate about 1,500 new private sector jobs in the city, with secondary city tax revenue increases eventually offsetting almost 9 percent of the direct clothing tax revenue loss. (The larger percentage offset for the under-$110 clothing tax cut mostly reflects the additional impact of the state sales tax reduction on the city economy.)
Books. Textbook sales to college students were exempted from all sales taxes beginning last summer. The Administration now proposes to extend the city sales tax exemption to all remaining book sales effective December 1st. IBO estimates that the proposed non-text exemption would cost nearly $10 million in 2000 and $18-$20 million per year thereafter in foregone sales tax revenues. This estimate reflects the fact that over 40 percent of total city retail book sales revenues are tax-exempt mail-order type sales and another 13 percent comprise newly exempt textbook sales.
The long term cost of the exemption could be lower than estimated here insofar as growing internet sales cut further into the taxable sales of local bookstores. A city book sales tax exemption would narrow the current tax advantage enjoyed by internet and other mail-order sellers competing against local booksellers.
Building materials and construction services. Goods and services used in major capital improvements are exempt from sales taxes in New York, but this exemption does not apply to repair and maintenance supplies and services. These supplies and services now generate approximately $3.5 billion in taxable sales in New York City, 40 percent of which is accounted for by construction contractors, 36 percent by hardware stores, and 24 percent by general merchandize and other retailers and wholesalers. Total taxable construction-related sales are projected to rise to close to $4 billion by 2003. Accordingly, IBO estimates that a two percentage point reduction in the city sales tax on building materials and construction services (effective December 1st) would lower city sales tax revenues by $41 million in 2000, $74 million in 2001, and $78 million in 2003.
Personal Income Tax Credits
The executive budget proposes a city personal income tax credit for resident shareholders of subchapter S corporations. Businesses incorporating under subchapter S face no federal corporate income tax and pay corporation franchise tax to the state at a much lower rate than other corporations. Their income is instead reported on the individual returns of shareholders and becomes part of both their federal and state taxable income. In New York City, on the other hand, S corps are subject to the same general corporation tax (GCT) as other corporations. As a result, city residents who are shareholders of local S corps are taxed twice by the city on their share of the corporationĺs income attributable to the city. In 1997, a very similar credit was made available for resident owners of businesses paying the cityĺs unincorporated business tax (UBT).
Under the proposal, a portion of city S corp GCT payments attributable to resident shareholders could be used as a credit against shareholdersĺ personal income tax (PIT) liability. For a resident with a state adjusted gross income of $42,000 or less, 65 percent of the GCT payments allocated to the taxpayer would be usable as a credit. The percentage of GCT payments usable as a credit would decline 1 percentage point for each $2,000 increase in income, leveling off at 15 percent when the adjusted gross income reached $142,000. This tax cut is expected to cost the city $51 million in 2000, and roughly $58 million a year for the remainder of the forecast period.
The City Council has proposed expanding the existing UBT credit against the city PIT. Their proposal, put forward in their response to the preliminary budget, would increase the amount of the credit for all but the highest income beneficiaries. Currently the percentage of UBT payments usable for the credit declines from 65 percent for taxpayers with adjusted gross incomes of $42,000 or less, to a minimum level of 15 percent, applicable to taxpayers with incomes of $142,000 or greater. The Council proposal would increase the maximum percentage of UBT payments creditable against PIT from 65 percent to 75 percent. The percentage usable as a PIT credit would still decline under the proposal, reaching a minimum credit of 15 percent for incomes of $172,000 or more. The cost to the city of expanding the UBT credit would be $10 million in 2000, increasing to $12 million in 2003.
Business Income Taxes
The executive budget proposes three changes in city business income taxes. City GCT taxpayers must calculate their liability using three different methods, and pay either the largest of the three calculated amounts or a minimum of $300. The first proposal would change one of the methods for calculating tax liability. The income plus compensation method accounted for a fifth of total GCT tax liability in 1992, but has determined liability for a declining number of GCT filers, as the compensation subject to tax has been gradually reduced in recent years.
The liability calculated under this method is now equal to 2.655 percent of the sum of the net income allocated to the city and the compensation paid to shareholders owning more than 5 percent of the corporationĺs outstanding stock, minus $40,000. The proposed change would increase the statutory deduction to $50,000. GCT taxpayers that use this method would save up to $266, less if a different method must be used to calculate liability after the tax change. We project a total cost to the city of $3 million in 2000, and $5 million in each year thereafter.
Another proposal would change the way payers of the unincorporated business tax (UBT) allocate income to the city, conforming the allocation method to that used by GCT payers. The portion of net business income taxable by the city is based on three factors: the portions of receipts that come from the city, payroll paid in the city, and the firmĺs tangible property located in the city. The UBT and GCT currently differ in the way they allocate receipts for services. For GCT taxpayers, services performed outside the city count as non-city receipts and therefore do not increase GCT liability. For the UBT, the allocation of such services is now based on the location of the employeeĺs office. Conforming the treatment of UBT service receipts to the GCT method is expected to cost the city $8 million in 2000 and $18 million annually for the rest of the forecast period. It would reduce taxes paid by city unincorporated businesses that perform services outside the city, and make it less expensive for such businesses to locate offices within the city.
The executive budget proposes another change in the way business income is allocated to the city. A 1989 change in the GCT allowed mutual funds to allocate earnings to the city according to the percentage of their shareholders who lived in the city, rather than on the basis of where services were performed. The same change was made for the state corporation income tax. The Mayor proposes that the banking corporation tax and the unincorporated business tax allocate income from mutual fund services in the same way. The loss to the city is expected to total about $1 million per year in foregone tax revenues.
Earned Income Tax Credit
The Mayorĺs tax reduction program includes a proposal to create an earned income tax credit (EITC) against the cityĺs personal income tax (PIT) for low-income working New Yorkers. The credit would become effective in the 1999 tax year and equal 25 percent of the current allowable New York State EITC, which itself is defined as 20 percent of the federal credit. Since the federal credit is adjusted annually for inflation, the value of the city EITC would not erode over time. Like the federal and state credits, the proposed city EITC would be refundable, meaning that filers whose allowable credit is greater than their pre-credit tax liability would receive a check for the excess amount of the EITC.
Because the amount of the credit for the lowest-income families increases as income from work increases, the EITC provides an incentive for labor force participation and thus complements efforts to move public assistance recipients into the paid workforce. For the 1998 tax year, for example, a household with two or more children received a federal EITC of 40 cents for every dollar earned up until $9,390Śthe annual income level at which the credit reached its maximum value of $3,756. The federal EITC remained at the maximum level for incomes up to $12,260 and then declined at a rate of roughly 21 cents for each additional dollar earned until it phased out entirely for income above $30,095. (Filers with one or no children received a smaller maximum credit that phased out at a lower level of income.)
Based on a large sample of city tax returns and IBOĺs forecast of income growth, we estimate that under the Mayorĺs proposal 574,000 households would receive $40.3 million of EITCs for the current tax yearŚan average credit of $70 per householdŚwith refunds accounting for $36.9 million of the total. The number of recipients and average value of the credit would increase over time, with 588,000 filers receiving an average credit of $79 each in tax year 2002. When the phase-in of STaRĺs personal income tax cuts is complete in 2002, the proposed EITC would almost halve the number of city households that pay city but not state income tax, from 112,000 to 60,000.
The total credits for any tax year would reduce the subsequent fiscal yearĺs PIT revenues by an equivalent amount; for example, 1999 tax year credits reduce PIT revenues in 2000. However, the cost to the city would be substantially reduced if, as proposed, a portion of New York Stateĺs TANF surplus is used to pay for most of the refunded tax credits. This use of the TANF surplus is legally permissible under guidelines recently issued by the U.S. Department of Health and Human Services, though the availability of the surplus to the city and the desirability of this use for the surplus are questionable.10 Despite these uncertainties, IBOĺs cost estimates are based on the assumption that $35 million in TANF funds will pay for EITC refunds in each year of the forecast period until 2003, when the TANF block grant to New York State is likely to be much lower than the current level and insufficient to yield a surplus. Thus, IBO expects the Mayorĺs proposed EITC to cost the city $5 million in 2000, $7 million in 2001, $9 million in 2002, and $46 million in 2003.
In its response to the preliminary budget, the City Council called for a refundable city EITC equal to 50 percent of the state EITCŚdouble the amount of the executive budget proposal. While the Councilĺs proposal would benefit about the same number of tax filers, its average benefit and cost (prior to possible use of the TANF surplus) would be roughly double the Administrationĺs. Under the Councilĺs proposal, by tax year 2002, only 38,000 households would pay city but not state income taxes. Moreover, this number would be reduced to just 3,500 filers if the Councilĺs EITC were enacted in conjunction with its proposed PIT credit for child care expenses equal to 50 percent of the current New York State credit.
III. Spending Estimates
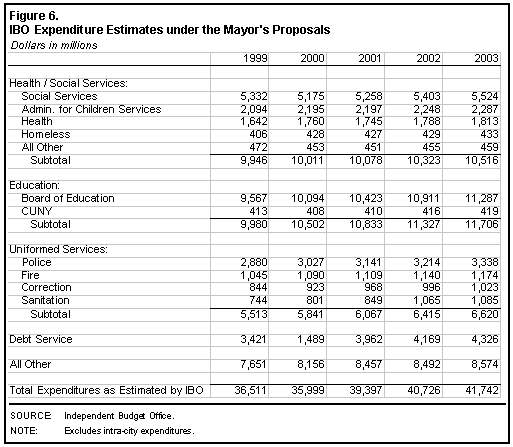
IBO estimates that total spending under the policies proposed in the Mayorĺs executive budget would decrease from $36.5 billion in 1999 to $36.0 billion in 2000. Under the financial plan proposed by the Mayor, spending would rise to $41.7 billion in 2003, an average annual growth rate of 3.4 percent. Figure 6 shows IBOĺs projections of spending by major area over the 1999 to 2003 period. Agency expenditures have been adjusted to reflect an allocation of the labor reserve (which funds collective bargaining pay increases for city employees) as well as expected increases in labor costs.
City-funded spending, which accounts for almost 70 percent of the budget, is funded with revenues generated from the collection of city taxes and other revenues from sources such as licenses and fees. IBO estimates that city-funded spending would be $25.3 billion in 1999 and $24.7 billion in 2000 under the Mayorĺs plan, rising to $30.0 billion in 2003Śan average annual rate of 4.4 percent.
State and federal categorical aid accounts for the remaining 30 percent of spending in the cityĺs budget. IBO estimates that total categorical aid would be $11.2 billion in both 1999 and 2000, rising to $11.7 billion in 2003, an average annual rate of 1.1 percent.
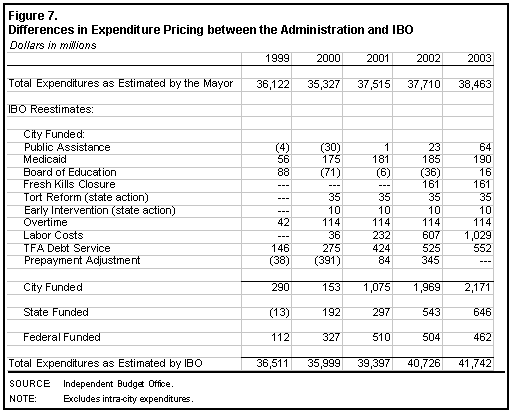
As shown in Figure 7, IBOĺs spending estimates exceed the projections contained in the Mayorĺs executive budget. IBOĺs reestimates of city-funded expenditures differ from the executive budget by $290 million in 1999 and $153 million in 2000, rising to $2.1 billion in 2003. The differences result largely from expected increases in labor costs and IBOĺs inclusion of Transitional Finance Authority (TFA) debt service costs in the city expenditure budget estimates. (Note that an amount equal to TFA debt service costs has been reflected in IBOĺs revenue projections.)
IBOĺs Analysis of the Mayorĺs Preliminary Budget for 2000 discussed the budgetary implications of a number of programmatic initiatives presented in the preliminary budget. This section highlights several programmatic initiatives that differ from those included in our March report. First, the Board of Education capital plan and funding for City University of New York (CUNY) are discussed. Next, proposals to accelerate police hiring, and restore funding for homemaking services and prevention programs of the Administration for Childrenĺs Services are presented, followed by a brief discussion of debt service costs.
BOE Capital Plan for 2000-2004
On May 12th, the Board of Education approved a $7.0 billion capital plan for 2000 to 2004 after rejecting a larger and more ambitious plan that had been crafted by the Chancellor over the past year. The Chancellorĺs $11.2 billion five-year planŚwhich had already been revised to address concerns that not enough resources were directed towards relieving overcrowding in QueensŚwas rejected by a majority of the Board made up of the members from Queens, Staten Island, and the two mayoral appointees. The majority was concerned that the Chancellorĺs revised plan relied too much on risky funding sources, and still did not do enough to address the projected needs of Staten Island and Queens.
The rejected $11.2 billion plan included funding from city, state, and federal funding sources, some of which were considered less secure than others (see IBOĺs Analysis of the Mayorĺs Preliminary Budget for 2000 for more details). In contrast, the plan approved by the Board depends entirely on funds deemed secure by the Mayor. These include $6.1 billion in city capital funds, $70 million in state funds from the 1996 Environmental Quality Bond Act for coal burner conversions plus an addition $100 million already appropriated by the City Council for coal burner conversions, and $300 million in federal aid. The new funding plan also includes $375 million from the expense budget that will be used for pay-as-you-go capital. These funds have already been included in the Mayorĺs financial plan.11
The adopted plan not only reduces the total amount of money to be spent it also shifts the priorities for spending the remaining funds, with the share directed towards new capacity falling from 44 percent to 40 percent. Under the $7.0 billion plan, the school system will add 59,650 new seats (32,950 from new projects plus 26,700 seats from projects carried over from the 1995 to 1999 capital plan). The $11.2 billion plan would have added 94,800 new seats (68,100 from new projects plus the same 26,700 seats from rollover projects). In addition, the $11.2 billion plan would have added the equivalent of 13,200 seats from such administrative solutions as year-round building use through staggered schedules and reconfiguring buildings originally designed for kindergarten through eighth grade for high school use. Overall, the new plan will provide 45 percent fewer seats compared to what would have been created had the $11.2 billion plan been adopted and fully funded.
The citywide reduction in the number of seats from new construction and leasing was not spread evenly among the boroughs. The plan rejected by the Board had already been adjusted to increase the new capacity projects in Queens. Therefore, Queensĺ share of the new seats is essentially the same under the two plans. The borough with the largest reduction in its share is Brooklyn. Only Staten Islandĺs share is significantly larger.
The $7.0 billion plan emphasizes safety issues over less pressing concerns when allocating resources for spending on existing facilities. The adopted plan leaves intact all building exterior projects, coal boiler conversions, and elevator projects contained in the $11.2 billion plan. However, under the adopted plan the Board will spend 71 percent less than it would have for interior rehabilitation and upgrades. For example, the plan completely eliminates funding for interior modernizations; climate control; and bathroom, kitchen, auditorium, gymnasium and athletic field improvements. Funding was reduced for science labs and computer access.
With Board of Education action completed, the capital plan now must be approved by the Mayor and City Council.
CUNY Community Colleges
In his presentation of the executive budget, the Mayor threatened to withhold the city's entire $79 million subsidy from the community colleges unless the CUNY Board of Trustees modifies remedial instruction in two ways. First, the community colleges must demonstrate that they use a test based on nationally accepted standards to determine whether students completing remedial courses have achieved college readiness. Second, CUNY must implement a voucher program to provide its students with funds to attend remedial courses at private institutions. Despite the strong language, the executive budget sustains the current level of city support for the community colleges, although the Mayor would presumably attempt to impound these funds after they are appropriated if his demands are not met.
The Mayor's proposal to withhold the subsidy, if implemented, would appear to violate state law requiring the city to maintain its nominal dollar subsidy from the previous year. Section 6304 of the state education law limits tuition and fees charged to students to no more than one-third of community college operating revenues. Since 1991, however, Section 6304 has been superseded by maintenance of effort (MOE) provisions in state budget legislation. Under the MOE language, CUNY may charge tuition in excess of one-third of operating costs as long as the city does not reduce its subsidy from the level provided in the previous year. Tuition revenues for CUNY community colleges have exceeded one-third of operating costs each year since school year 1991-1992. Moreover, the city subsidy has fallen from 43 percent of operating costs to 23 percent over the past decade.
The level of spending required under the MOE provisions is determined by the previous year's contribution (either total or per pupil, whichever is less), without adjustment for inflation. The city's subsidy of CUNY community colleges measured in nominal dollars has remained largely unchanged over the past several years. As CUNY's costsŚincluding collective bargaining agreementsŚhave increased, the real value of the city subsidy has continued to shrink. The State Assembly's budget resolution for fiscal year 1999-2000 proposes a stronger maintenance of effort provision that would require local sponsors to once again provide at least one-third of operating revenues. IBO estimates that the city would have to increase its annual contribution by $30 million to $40 million to reach the one-third funding threshold.
Two reports issued in March 1999 further discuss community college funding: IBO's Analysis of the Mayor's Preliminary Budget and the State Comptroller's New York State's Community Colleges.
Police Department
The executive budget proposes expenditures of $2.9 billion for the Police Department (NYPD) in 2000Śan increase of $30 million over the level proposed in the preliminary budget and $74 million over expected 1999 expenditures. The additional funds included in the executive budget, over and above amounts included in the preliminary budget, would be used to fund a number of recruitment initiatives and productivity enhancements, including:
- $6.9 million in 2000 and $13.1 annually thereafter to hire 1,200 new police cadets out of New York City schools as part of an effort to increase recruitment of city residents;
- $3.1 million to hire additional civilians in order to enhance the capability of the agencyĺs emergency response (911) system;
- $2.9 million for training and supervising 3,400 school safety officers, a responsibility that was transferred from the Board of Education to the NYPD in December 1998; and
- $1.3 million to hire 150 additional school crossing guards.
Competing hiring plans. The Mayor proposes to accelerate the hiring of 1,589 police officers by six months, at a cost of $32 million in 2000. If implemented, the proposal would result in uniformed staffing reaching an historic high of nearly 41,000 officers on January 1, 2000. The City Council, however, opposes the accelerated hiring plan. Instead, the Council has proposed to spend $8 million to expand civilianization efforts within the NYPD. The Council advocates this move as a first step towards returning 500 police officers to direct law enforcement activities. In addition, the Council has proposed to allocate another $10 million for initiatives aimed at improving NYPD's training program, recruiting efforts, and internal policing procedures. Discussion of police staffing and crime reduction trends in New York and other major U.S. cities is provided in IBOĺs Analysis of the Mayorĺs Preliminary Budget (March 1999) and in a special April 19th edition of IBOĺs Inside the Budget newsfax.
Spending forecast. IBO projects that adoption of the executive budget would result in NYPD spending of just over $3 billion in 2000, about $107 million more than estimated by the Mayor. IBOĺs higher estimate is in large part attributable to our forecast of higher overtime expenditures. From 1999 through 2003, we project NYPD spending will increase at an annual average rate of 3.8 percent, with salary increases being the most significant factor associated with the rise in spending.
Administration for Childrenĺs Services
Preventive services. The executive budget restores all $18.1 million (about $4.5 million in city funds and $13.6 million in state funds) for homemaking services cut in the Mayorĺs preliminary budget. Homemaking services are provided to families involved with the child welfare system that need assistance due to a family memberĺs disability. The budget also restores $4.4 million (about $1.1 million in city funds and $3.3 million in state funds) of $6 million cut in January for prevention programs at Beacon schools.
Foster care. Consistent with a funding plan included in the 1999 adopted budget, but never implemented, the executive budget provides an increase of $43.3 million in the pass-thru stipends paid to foster parents¾ $14.3 million in city funds, $14.3 million in state funds, and $14.7 million in federal funds. The proposed level of funding would allow the city to pay foster parents at 100 percent of the maximum state aid rate.
Debt Service
New York City borrows money by issuing bonds to pay for capital spending on schools, bridges, and other kinds of public infrastructure. Debt service is the repayment of the borrowed funds plus interest. Net of prepayments, IBO projects the city will spend $3.3 billion on debt service in 1999, $3.5 billion in 2000, and an average of $4.2 billion per year in 2001, 2002, and 2003. Transitional Finance Authority (TFA) debt service is included in IBOĺs projections, although the executive budget excludes payments on TFA debt.
The cityĺs recent practice of prepaying one yearĺs scheduled debt service with funds deposited into the budget stabilization account in the previous fiscal year obfuscates underlying trends in debt service. The executive budget shows debt service, not counting budget stabilization account payments, costing $1.3 billion in 1999, $1.2 billion in 2000, and an average of $3.4 billion annually in 2001 to 2003. After reversing the effect on debt service of these prepayments, we find that debt service as a percentage of tax revenues will rise from 11.1 percent in 1990 to 16.4 percent in 2000 and 20.1 percent in 2003. The cityĺs increasing debt service payments compete with other city operating needs and, coupled with a high level of outstanding debt, also strain the cityĺs credit rating and push up the interest rates the city must pay to borrow.
The cityĺs need for capital faces a legal constraint as well¾ the constitutional debt limit on the amount of general obligation debt New York City can incur. With the cityĺs debt limit set at $28.9 billion for the current fiscal year, the remaining debt-incurring power as of December 31, 1998, was $2.3 billion. The executive budget predicts that the debt limit will restrict the cityĺs ability to enter into new capital commitments in 2000.
Because any change in the state constitution requires legislative approval in consecutive sessions and a statewide voter referendum, the debt limit formula could be altered no earlier than January 1, 2002. The city drafted a constitutional amendment in 1998, but no bill was ever submitted to the state legislature.
The TFA, created in 1997, has provided a way to borrow despite the debt limit. The state has authorized the city to issue $7.5 billion of TFA debt, which is backed by the city personal income tax. These borrowings are not subject to the debt limit. The TFA issued $2.2 billion of bonds in 1998 and will account for more than 60 percent of new indebtedness from 1999 through 2001. The executive budget forecasts no more TFA debt issuance after the $7.5 billion authorization is exhausted in 2001.
Short of a constitutional amendment, there are two ways that the legal limits on the city's borrowing could be circumvented. The Mayor and Comptroller have established the Tobacco Settlement Asset Securitization Corporation to issue $2.5 billion of bonds over four years. These bonds would be secured by payments due the city as part of a recent settlement with the nation's tobacco companies. For the time being, the corporation will not be able to issue bonds because the settlement has not been ratified by the states involved in the lawsuit.
Alternatively, the state could amend the 1997 law and increase the TFA authorization. The TFA agreement with its bondholders would permit the authority to issue $12 billion of debt¾ $4.5 billion more than the state has currently authorized. While such an amendment would alleviate the debt limit issue, the city must continue to address the problem of rising debt service costs competing with the operating needs of city government.
A fuller discussion of the three types of city debt (General Obligation, Municipal Assistance Corporation, and Transitional Finance Authority), the debt limit, the high debt service burden, and the cityĺs bond rating can be found in IBOĺs Analysis of the Mayorĺs Preliminary Budget for 2000.
Footnotes
| 1 | In order to present a clearer picture of revenue growth, references to tax revenues in the text of this chapter will include the portion of personal income tax revenues dedicated to the Transitional Finance Authority. In the tables, however, TFA-dedicated revenues are reported on separate lines in order to present figures that are comparable to those of the executive budget. See IBO's May 1998 report, Analysis of the Mayor's Executive Budget for 1999, for a discussion of the Administration's decision to remove TFA-dedicated revenues and TFA debt service payments from the city budget. |
| 2 | This surcharge, proceeds of which have generally been used to fund criminal justice programs, was allowed to expire after tax year 1998. Another surcharge, equal to 14 percent of pre-surcharge liability, will expire at the end of 1999 unless renewed. Because the 14 percent surcharge has been already renewed three times by the city and state, IBO's forecast assumes its continuation. |
| 3 | The effective tax rates for coops and condos are based on true market value rather than the official city market value, which is artificially lowered under section 581 of the real property tax law. See IBO, The Coop/Condo Abatement and Residential Property Tax Reform in New York City, December 1998. |
| 4 | For apartments in buildings with average assessed values of $15,000 or less per apartment, the percentage is 25 percent. Only apartments that have been sold by the sponsor or developer qualify. Also, buildings enjoying J-51 or 421-a benefits are excluded. |
| 5 | For buildings with average assessed values of $15,000 or less the abatement would be 30 percent in 2001 and 32.75 percent in 2002 and 2003. |
| 6 | For further discussion of these points see IBO, Analysis of the Mayor's Preliminary Budget, March 1998, pp. 13-14. |
| 7 | Although there no longer is a formal connection between the Mayor's scaled-back CRT reduction and stadium financing, the amounts budgeted for the proposed Sports Facility Corporation remain at the level set in the April 1998 proposal. |
| 8 | In order to be consistent with OMB's presentation, these estimated costs include reductions in audit revenues attributable to the proposals. Note that all other tax program costs are estimated without accounting for their impact on audit revenues. |
| 9 | The city job impact is not larger because nearly half of the new retail clothing sales revenue generated by the tax cut pays for output produced outside the city. |
| 10 | State officials have not yet made clear how much, if any, of the TANF surplus would be made available to the city. Moreover, there are proposals to use a portion of the surplus to finance the state's own EITC refunds, making the availability of the surplus uncertain. Finally, even if funds are available, use of the TANF surplus to fund EITC refunds might limit the city's ability to implement and finance other welfare reform policies, such as expanded work programs or subsidized child care. |
| 11 | The rejected capital plan had counted on freeing up $750 million from the expense budget for pay-as-you-go, but the Mayor has recognized only half of these funds. |
| This report was completed under the supervision of Ronnie Lowenstein who leads our Economic Analysis Division and Frank Posillico who heads our Budget Projections Unit. Christine Lidbury served as project manager for the report, while Mark Schreiner coordinated final production.
Independent Budget Office
Doug Criscitello, Director
|