
October 2016
Preferences and Outcomes:
A Look at the New York City's Public High School Choice Process
PDF version available here.
Summary
For more than a decade the city’s public school system has used a computer-based algorithm to determine which high school most middle-school students will attend. The goal of the algorithm is to match as many students as possible—out of the roughly 80,000 who apply to the city’s public high schools each year—with their top choice schools while taking into account the schools’ admission criteria and the availability of seats. (The city’s specialized high schools such as Stuyvesant, Brooklyn Tech, and LaGuardia are exempt from this procedure—admission to these schools is based solely on the specialized high school test or an audition).
Based on our analysis of the high school choice process the algorithm fulfills its task well. But our analysis also raises questions that go beyond the matching process, mostly in terms of how students with different academic backgrounds rank their high school preferences. Factors such as access to information about the process, guidance from school staff, and the influence of their peers about the schools they should attend, appear to play an important role. Among our main findings:
- Considerably more students list the more selective high schools among their top choices than there are seats available in these schools. Conversely, fewer students indicate a preference for less selective high schools than there are seats available.
- Students who on average are lower achieving (based on their state math test scores) are routinely matched with lower performing high schools (based on the high schools’ graduation rates and Progress Report scores). But the prime reason for this matching is students’ own preferences—in fact, the rates of acceptance to students’ top choice high school programs are highest among lower-achieving students applying to those programs.
- Lower-achieving students’ first-choice schools tend to be lower performing, have more disadvantaged students, and have less selective programs, than the first choice of higher-achieving students.
- Regardless of their own academic performance, students in higher performing middle schools tend to list higher performing high schools. In contrast, even higher-achieving students in lower performing middle schools often list lower performing high schools as their top choices.
- Many students in Staten Island and Brooklyn as well as lower-achieving students in the Bronx tend to prefer high schools closer to their homes than the citywide average distance that high-school students travel to school.
The city’s Department of Education is currently revamping its middle school choice process. To the extent that the mix of students at individual middle schools changes, there may be ripple effects on how students determine their high school preferences, especially when it comes to factors such as the influence of peers.
Introduction and BackgroundEach year, nearly 80,000 middle school students in New York City participate in the lengthy and complex process of applying to a public high school program. Every New York City eighth grader has a chance to apply to any public high school program in the city. In the fall of 2012, those students were choosing from 691 programs in 411 public high schools.1 The assignment of students to high school programs, except for the specialized high schools where admission is solely based on performance on an entrance test, proceeds through a specially designed “two-sided deferred-acceptance matching algorithm.”2 The program was first used in New York City in school year 2003-2004 and the main contours of the program remain in use despite the change in administration.
The explicit goal of this algorithm is to assign as many students as possible into programs that they rank highly, given constraints due to limited seats available in individual programs and the programs’ admission priorities. Students submit an application in which they list up to 12 high school programs ranked in order of preference. High school programs learn which students asked for a spot, but not how they ranked them, and then rank those students based on their own criteria. The algorithmic part of the process acts as a “clearinghouse” that processes students’ lists of preference according to the following rules:
- Each school “holds” the applicants it ranks highest, up to the number of seats it has available, and rejects the rest;
- Students receive an offer from the school they ranked highest among those schools that have accepted them (if any);
- Students with offers are taken off the list, whereas students who have been rejected are moved to the next school (if any) on their list of preferences;
- The process stops when there are no available seats remaining in schools on students’ lists of preferences.3
The two key features of the matching process are the fact that schools are not aware of the students’ rankings, and that schools are able to directly compare all candidates who have applied for a seat. Together, those features ensure that there are no incentives to “game the system” either on the side of students or schools. This is in contrast to the previous system, where there was evidence of such gaming, by both students and schools: students were sometimes better off misreporting their true preferences, while schools were sometimes better off withholding some of their seats early on in the process in the hopes that preferable candidates would show up later.4
However, the intricacies of the matching procedure are not the only source of complexity in the high school application process. As mentioned earlier, students are choosing from nearly 700 programs in more than 400 schools. Those programs are very diverse in terms of their screening criteria, size, area of substantive focus, the student body they serve, extracurricular activities they offer, and other factors. In order to make an informed choice, students need information—which comes in the form of a 600-page Department of Education (DOE) guide called the New York City High School Directory—and help from parents, teachers, and guidance counselors.5
In terms of screening criteria, there are seven types of high school programs in New York City: audition, educational option, limited unscreened, screened, specialized, unscreened, and zoned. Admission criteria for each type of school are described below.
Audition programs require that a student demonstrate proficiency in the specific performing arts/visual arts area for that program. For example, if a student auditions for a drama program, he or she may have to prepare a monologue as part of the audition. The audition requirements, dates, and times are listed with the program on each school’s directory page.
Educational Option programs categorize applicants into one of three groups based upon the results of their seventh grade standardized reading test score: Top 16 percent–High; Middle 68 percent–Middle; and Bottom 16 percent–Low. From the applicant pool of a given school, half the students are chosen by the school administration and half are selected randomly. However, students who score in the top 2 percent on the seventh grade English Language Arts reading exam will automatically be matched to the Educational Option program if they listed it as their first choice.
Limited Unscreened programs give priority to students who demonstrate interest in the school by attending a school’s information session or open house events or visiting the school’s exhibit at any one of the high school fairs.
Screened programs rank applicants based on their final seventh grade report card grades and reading and math standardized test scores. Attendance and punctuality are also considered. There may also be other items that schools require to screen applicants such as an interview, essay, or additional diagnostic test score. Specialized high schools, with one exception, require applicants to take the Specialized High Schools Admissions Test (SHSAT) for entrance; results of those tests are the sole determinant of eligibility. Entrance to one specialized high school—La Guardia—is based solely on audition and not the SHSAT.
Unscreened programs select randomly from the pool of applicants.
Zoned programs give priority to students who live in the geographic zoned area of the high school. There are zoned high schools in Brooklyn, Staten Island, Queens, and the Bronx. Manhattan does not have zoned high schools.
In addition to these primary screening criteria, many programs (except the specialized ones) also add one or more secondary criteria. In most cases, those secondary criteria are geographic in nature, such as giving priority to students applying from a certain borough, school district, or neighborhood. But in some cases factors other than geography are used; for example, some programs give priority to native speakers of certain foreign languages or to continuing eighth graders. Full details can be found in the high school directory.
Specialized programs are not explicitly part of the high school choice procedure, which in practice means that eighth graders are not allowed to put those programs on their list of preferences for the matching process. This is because the test or audition results are the sole criterion of eligibility for those programs and admission does not rely on the matching process. However, students applying to specialized programs are very much part of the process in that everyone who seeks admission to a specialized high school is still allowed to submit their list of up to 12 nonspecialized public high school programs. On average, roughly one-third of aspiring high school freshmen apply to the specialized high schools and about 15 percent of applicants are accepted.
Among the six types of high school programs—other than the specialized high schools that use the Specialized High Schools Admissions Test—the degree of selectivity varies widely. The audition and screened programs are considered the most selective.
Note on Data Sources and SamplesThis report used data on student choices and outcomes in eight consecutive iterations of the current high school choice process, starting with school year 2004-2005 and ending with school year 2011-2012. In each school year, the sample included all students applying from New York City public schools; that is, students applying from private or parochial schools were excluded.6 The applicant cohort sizes in different school years were as follows.
| Table 1: Number of High School Application Process Participants by School Year | ||||||||
|---|---|---|---|---|---|---|---|---|
| 2004-2005 | 2005-2006 | 2006-2007 | 2007-2008 | 2008-2009 | 2009-2010 | 2010-2011 | 2011-2012 | |
| Public School Applicants | 84,082 | 84,173 | 79,610 | 76,759 | 75,262 | 72,021 | 72,996 | 71,570 |
| Private or Parochial School Applicants | 6,042 | 5,449 | 4,423 | 4,471 | 8,258 | 5,411 | 5,176 | 5,648 |
| TOTAL | 90,124 | 89,622 | 84,033 | 81,230 | 83,520 | 77,432 | 78,172 | 77,218 |
| SOURCE: IBO analysis of Department of Education data on individual student records | ||||||||
| New York City Independent Budget Office | ||||||||
All of the analyses presented in this report were conducted for each of the school years 2004-2005 through 2011-2012. However, most of the specific findings discussed in this brief pertain to 2011-2012; in cases where there is a discrepancy between 2011-2012 results and those in any of the previous school years, the discrepancy is explicitly noted. This brief focuses on only the first choices of applicants—the results, not separately reported, are very similar if one considers instead the top-three choices.
The primary data sources were eight student-level files provided by DOE with key variables describing the admissions process itself. Some variables (both student- and school-level), however, were not included in those files and, for the purposes of this analysis, were brought over from two other types of DOE files: the so-called “Biographic Files” (student middle school test scores), and “School Progress Reports” (middle school performance (i.e. average mathematics proficiency); high school graduation rates; high school peer indices; high school safety score; high school enrollment; high school progress report score, etc.).
Brief Description of the 2011-2012 SampleThis section provides some basic descriptive statistics of the 2012 sample. The borough that was home to the largest share of high school applicants is Brooklyn (32 percent) followed by Queens (28 percent); 23 percent of applicants resided in the Bronx with 11 percent in Manhattan and 6 percent in Staten Island. In terms of self-identified ethnicity, 40 percent of applicants described themselves as Hispanic, 31 percent as black, 16 percent as Asian, and 12.5 percent as white.7
In what follows, many comparisons are made between applicants of different levels of seventh-grade achievement. More precisely, using each applicant’s scaled score on the seventh grade state mathematics test, they are assigned to one of three categories based on the lowest-, middle-, and highest-third of the citywide distribution of scale scores. In the top third, there is an overrepresentation of students from Queens (36 percent) and students who identify themselves as Asian (31 percent) or white (21 percent), and an underrepresentation of students from the Bronx (14 percent) and students who identify themselves as Hispanic (28 percent) or black (19 percent). In the bottom third, there is an overrepresentation of students who live in the Bronx (31 percent) and who identify themselves as black (40 percent) or Hispanic (47.5 percent), and an underrepresentation of applicants residing in Queens (22 percent) and Staten Island (4 percent) and who identify themselves as Asian (6 percent) or white (also 6 percent).
Choices and Placements by Type of ProgramAmong students applying to high schools, considerably more students want to be placed in audition and screened programs than there are available seats in these programs, and significantly fewer students wish to be placed in educational option, limited unscreened, unscreened, and zoned programs than there are seats offered in these types of programs. These statistics are shown in Figure 1, where the number of applicants who listed a program of specific type as their first choice is compared with the final placement numbers.
A detailed analysis of admissions to screened programs revealed that, of all students who listed a screened program as their first choice but were not admitted to one, from 15 percent to 18 percent (depending on the year in question) were academically high-achieving students, with both math and reading test scores higher than the average score of all applicants to their specific screened programs. This probably reflects the nature of screened programs, some of which consider attributes such as attendance in addition to test scores.
When high school programs are categorized based on the area of substantive focus, there are considerably more applications than seats in humanities and science and math programs and slightly more in performing arts, law and government, health professions, engineering, and culinary arts programs (Figure 2).8
Student Achievement and Choices
There is a clear positive correlation between the relative achievement level of individual applicants, and the average “quality” of high school programs they choose. This correlation may in turn be the result of the fact that higher-achieving applicants tend to prefer high school programs with more selective admission criteria, whereas lower-achieving applicants tend to choose programs in which those criteria are markedly less stringent. It is important to note that, as mentioned earlier, under the school assignment mechanism currently in use in the city’s high school application process, applicants never gain by misreporting their true preferences—unlike prior versions of the matching process when students could sometimes be better off with strategic rather than sincere choices.
The key differences steering the discrepancy in final assignments are the choices that students make on their applications and not the matching process itself. Lower-achieving students tend to pick programs that are less selective and less selective programs also happen to be lower-performing—as measured by graduation rate—than the more selective ones.9 This resulted in lower-achieving students eventually being matched with schools that were lower performing. For example, while the average graduation rate of high schools citywide was 73 percent for the class of 2012, the average graduation rates of high schools to which students with seventh grade math scores in the bottom, middle, and top third citywide were matched with were 68 percent, 73 percent, and 81 percent, respectively.10 However, this discrepancy is not caused by the fact that the matching process makes it more difficult for lower-achieving students than for higher-achieving students to be assigned to their first choice program. In fact, the exact opposite is the case: the rates of acceptance to the most preferred programs are highest among lower-achieving students: 58 percent of lower-achieving students were matched with their first choice program in the main round of the process, whereas the same was true for 54 percent of applicants whose scores fell in the middle third of the overall distribution of test scores, and 53 percent of the highest-achieving students.
When this variation in students’ choices is taken into account, placement of lower-achieving applicants across higher- and lower-performing high schools is not appreciably different from that of higher-achieving applicants. For example, 37 percent of students ranking in the lowest third citywide were placed in high schools with lower graduation rates than high schools that they listed as their first choice; the same was true of 42 percent of students in the middle third and 38 percent in the top third. In addition, in all three groups the average difference between the graduation rate of students’ first choice schools and the graduation rate of students’ final placement schools was very small.
The differences between lower- and higher-achieving applicants in terms of the selectivity of their preferred program can be seen in Figure 3.
These differences in first choice of programs by students at different achievement levels are starkest when comparing educational option, limited unscreened, and screened programs. These three programs are the most popular programs in terms of the number of students who pick them as their first choice; together the three types of programs accounted for 86 percent of students’ first choices. Of these three types, screened programs are the most selective, taking into consideration students’ seventh grade report cards, standardized reading and mathematics scores, as well as attendance and punctuality records. Limited unscreened and educational options programs are far less selective. In the former type of program, half of the seats are filled by random selection of applicants; in the latter type, all seats are filled through random selection from a pool of applicants who have demonstrated interest in the program by attending a school’s information session or open house events or visiting the school’s exhibit at any one of the high school fairs.
Top-performing students favored screened high school programs by a wide margin; over two-thirds of students in the top third of achievement ranked screened programs as their first choice. Screened programs were also popular among students performing in the middle third, but many of them instead opted for limited unscreened programs and educational options programs. For students in the lowest third of achievement, limited unscreened programs were the most popular first choice, followed by educational options programs. Not surprisingly, at limited unscreened and educational options programs, students in the middle and lower thirds accounted for the majority of applicants for whom one of these programs was their first choice. At screened programs, on the other hand, students scoring in the top third were by far the largest group of applicants.
Compared with selective programs, less selective programs tend to be part of high schools that are lower performing and enroll a disproportionate share of higher-needs students.11 (We shift to looking at high schools here because much of the outcome data we use are reported at the school level rather than for individual programs.) Because of this there are also differences between lower- and higher-achieving students in terms of their most preferred high schools’ performance metrics (such as graduation rates or DOE Progress Report scores) as well as measures of the level of need of the population served by these high schools (such as the DOE peer index, described in more detail below, or percent of students who are eligible for free lunch). Lower-achieving students’ first-choice programs tend to be housed in lower performing high schools with greater shares of disadvantaged students, compared with first-choice programs of higher-achieving students.
The average graduation rate of high schools indicated as first choice by all students who have tested in the bottom third citywide in terms of mathematics scores is 76 percent, the rate for schools that were first choice for students scoring in the middle third citywide is 82 percent, and the average graduation rate for schools favored by top-third students citywide is 89 percent. (For reference, the citywide average graduation rate for high schools for the Class of 2012 was 73 percent.)
Another measure of the performance of a high school that is available for the period under study is the school’s Progress Report score. It is a metric that was used annually by the DOE to assess the “influence of schools on learning,” but was discontinued in 2014. The score was intended to allow comparison of student achievement and progress between schools in such a way as to take into account differences between student populations served by individual schools. The overall Progress Report score was constructed to be a number between 0 and 100, with higher scores indicating comparatively better performance. The average overall Progress Report score of high schools that were the first choice of students who ranked in the bottom third citywide on the seventh grade state math test was 66; for students who scored in the middle third citywide the average progress report score of their first choices were 68, and the average score for the first choices of top third of students citywide was 72. (For reference, the citywide average high school Progress Report score was 65, with a minimum and maximum of 19.6 and 98.7).
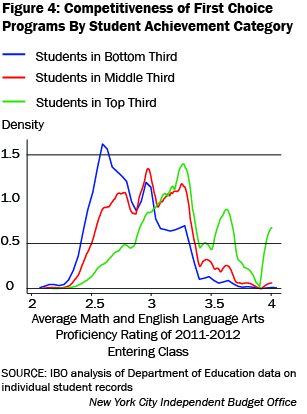
These comparisons suggest that students whose seventh grade math scores are in the lower third of citywide scores tend to choose programs that are in high schools scoring lower in DOE’s Progress Report scores; conversely, higher-achieving students tend to apply to programs housed in schools with stronger Progress Report scores. Figure 4 compares not just the averages but the entire distributions of another important indicator of individual high schools: prior academic performance of their incoming students. Based on their scaled scores in middle school ELA and mathematics state test, students are assigned one of the four proficiency ratings, ranging from 1 (“below standard”) to 4 (“exceeding standard”).12 The DOE Progress Report for each high school provides the average eighth grade mathematics and English Language Arts proficiency ratings earned by the students in the high school’s entering class. The numbers on the horizontal axis of Figure 4 are high school-level averages of those proficiency ratings of all students who entered each high school for the 2010-2011 school year. We assume that the higher the average of the proficiency scores of a school’s incoming students in 2010-2011, the more ambitious it is as a choice for middle school students applying to the program in 2011-2012.13 Figure 4 shows that most students in the bottom third of citywide distribution of seventh grade math scale scores (brown line) apply to high schools with the lowest average proficiency ratings (from 2.0 to 3.0) of their incoming students, whereas most students from the top third citywide (red line) apply to high schools with proficiency ratings of incoming students from 3.2 to 4.1.
Beyond the evidence that students who were higher achieving in middle school disproportionately apply to high schools that rank higher on various measures of student performance, our analysis also shows that high achieving middle schoolers select high schools with relatively few high-needs students as their first choice; conversely, lower achieving middle school students select as their first choice high schools with substantial shares of high-needs students. The extent to which a high school serves a higher-needs population is measured by DOE’s peer index, which was constructed by the department for use in the school Progress Reports. The peer index is scaled from 1.0 to 4.5, and its formula takes as inputs average eighth grade English and math proficiency, percentage of students with disabilities, percentage of students with disabilities who are taught in self-contained classroom rather than integrated ones, and percentage of students who are overage for their grade. The formula is constructed such that a lower peer index indicates a higher need population. Citywide, the average peer index for high schools is 2.2 (with minimum of 0.6 and maximum of 4.1). The average peer index of high schools indicated as first choice by all students who have tested in the bottom third citywide in terms of seventh grade mathematics scores is 2.3. The same metric for students scoring in the middle third citywide is 2.5 and for students in the top third citywide it is 2.9.
Influence of Middle School Quality On Preferences of StudentsThe relationship between individual student performance and high school choices is mirrored in the relationship between middle school quality and students’ high school choices. Students applying from higher performing middle schools tend to prefer more selective and higher performing high schools than their counterparts in lower performing middle schools. This observation holds up across a variety of measures of middle school or high school “quality.”
For this analysis, IBO uses the average proficiency scores of a middle school as a measure of the quality of the school. This measure is closely and positively related to the graduation rates of the first-choice high schools to which a middle school’s students apply.14
Notably, our analysis finds evidence of school effects independent of student effects when examining the impact of performance on high school preferences. In Tables 2 and 3, students in the same citywide achievement categories still differ in preferences depending on the relative quality of the middle school that they attend.
We compare average graduation rates of applicants’ first choice high schools, broken down by both applicants’ individual achievement relative to citywide achievement and the performance of the middle school that they attend. Middle schools are divided into three categories—bottom third, middle third, and top third —based on their average mathematics proficiency level relative to citywide middle school performance. Within each group of middle schools, higher-performing applicants choose high schools with better graduation rates compared with lower-performing applicants.
But high school choices also depend on middle school attended—lower-performing applicants from top third middle schools applied to high schools with better graduation rates compared with lower-performing applicants from middle-third middle schools and bottom-third middle schools; a similar hierarchy across groups of middle schools exists for both higher-performing applicants and medium-performing applicants. For example, among applicants performing in the bottom third, those who had attended middle schools ranked in the bottom third citywide chose high schools with an average graduation rate of 74 percent. Yet similarly low-performing applicants attending middle schools ranked in the top third citywide chose high schools where graduation rates averaged 6 percentage points higher (80 percent). The same positive relationship is evident for both students scoring in the middle third and students scoring in the top third. Looking from another perspective, high-performing students chose high schools with higher graduation rates compared with their low-performing peers attending similar schools. This relationship holds true across high- and low-performing students within each of the three categories of middle schools; the difference in graduation rates in students’ first choice high schools, between students in the top third and students in the bottom third, is about 10 percentage points in each case.
| Table 2: Average Graduation Rates of First Choice High Schools, by Applicant Performance and Middle School Quality, 2011-2012 | |||
|---|---|---|---|
| Performance Level of Applicant (Citywide Mathematics Achievement Category) |
Middle Schools Grouped by Proficiency Level in Mathematics | ||
| Schools in Bottom Third | Schools in Middle Third | Schools in Top Third | |
| Bottom Third | 74% | 76% | 80% |
| Middle Third | 78% | 81% | 85% |
| Top Third | 83% | 86% | 90% |
| SOURCE: IBO analysis of Department of Education data on individual student records NOTE: The entry in each cell shows the average graduation rate of high schools that were top choices for that applicant-school combination. For example, low-performing students attending bottom third middle schools listed as first choice high schools where the average graduation rate was 74% |
|||
| New York City Independent Budget Office | |||
Looking at a similar cross tabulation, this time using the average Progress Report scores to measure high school performance for each applicant’s first choice high school, an analogous pattern can be observed. Across the board, higher-achieving applicants and applicants from higher preforming middle schools tend to choose higher-performing programs. In both cases, there is evidence that regardless of individual students’ performance, they are more likely to choose higher performing high schools if they are in higher performing middle schools, and lower performing high schools if they are attending lower performing middle schools.
| Table 3: Average Progress Report Scores of First Choice High Schools, by Applicant Performance and Middle School Quality, 2011-2012 | |||
|---|---|---|---|
| Performance Level of Applicant (Citywide Mathematics Achievement Category) |
Middle Schools Grouped by Proficiency Level in Mathematics | ||
| Schools in Bottom Third | Schools in Middle Third | Schools in Top Third | |
| Bottom Third | 64.75 | 65.85 | 68.48 |
| Middle Third | 67.07 | 68.04 | 20.26 |
| Top Third | 69.89 | 70.35 | 72.54 |
| SOURCE: IBO analysis of Department of Education data on individual student records NOTE: The entry in each cell shows the average progress report score of high schools that were top choices for that applicant-school combination. For example, low-performing students attending bottom third middle schools listed as first choice high schools where the average progress report score was 64.75. |
|||
| New York City Independent Budget Office | |||
The school effect can also be seen by comparing the complete distributions of the preferences of high-achieving students citywide applying from high performing middle schools and of high-achieving students citywide applying from low performing middle schools. This comparison is shown in Figure 5, which plots distributions of average mathematics and ELA proficiency ratings of each high school’s entering class from the previous year. These distributions are plotted for the first choice high schools of four separate “types” of students defined to depend on the combination of four parameters. “High-scoring students” were those whose seventh grade mathematics test scores placed them in the top third citywide; “low-scoring students” were those whose scores placed them in the bottom third. “High achieving” and “low achieving” middle schools are those in the top and bottom third citywide in terms of average student mathematics test scores.
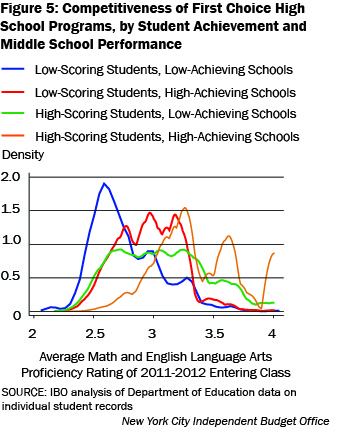
There is a striking difference in the choices made by high-achieving students applying from low performing middle schools (heavy blue line) from the choices of high-achieving students from high performing middle schools (heavy red line).15 These results suggest that the positive correlation between the average quality of a middle school and the average quality of high schools chosen by applicants from that middle school is not simply explained by the fact that better middle schools tend to have more high-achieving students, and high-achieving students tend to prefer higher performing high schools. Instead, it appears that the quality of a middle school affects student high school preferences. There are a number of ways in which middle schools can affect the preferences of their students regarding high school; for example, some schools might provide more information about potential choices, and some might foster stronger teacher-student relationships where teachers help students to find better matches.
In earlier work IBO has documented considerable divergence across New York City public middle schools with respect to the availability of arts and music, advanced courses and Regents exams.16 These discrepancies might lead students from different types of middle schools to opt for different high school programs, such as choosing an arts program over a science-based curriculum. There is also the issue of peer influence—a large literature in education has shown how peers strongly influence choice of educational options, particularly among teenagers and adolescents. A middle school with a higher share of high-performing students is likely to induce some middle- and low-performing students in that school to apply to high schools with better graduation outcomes. Conversely, a middle school where most students are performing at a relatively low level might find that even its best students avoid applying to top high schools.
These results on clustering of high school choices by middle school attendance have important implications regarding the high school a student actually attends, as most students are matched with one of their top choices. There are multiple channels through which such a relationship probably perpetuates itself—peer effects, geographical proximity and impact of middle schools on student performance. Middle schools probably have limited control over the student composition at their campuses, but factors like information sessions at the school and individual student levels, and the provision of guidance counselors specializing in high school matching, might assist students in navigating the process.
Student Preferences with Respect To High School ProximityWhile high school academic characteristics play a central role in applicants’ choices, other factors come into play as well. One such factor is the distance of the school from the student’s home. Using data on student and school addresses, IBO has calculated geographical distances between students’ places of residence and city high schools. These calculations have to be interpreted with caution, however. The measure this brief uses is straight-line distances between the home and school rather than commuting distances or travel time, which can vary greatly even when straight-line distances are the same.
The average straight-line distance between students’ homes and their first choice high school is roughly 2.5 miles. The average distances of second, third, and further choices are progressively longer. This analysis also suggests that students in Staten Island, Brooklyn, and lower-achieving students in the Bronx, tend to choose programs located closer to home than the citywide average distance. Students in Manhattan, Queens, and higher-achieving students in the Bronx tend to prefer programs located farther from their home. However, as illustrated by Table 4, in terms of distance measured in miles, those differences are relatively small.
| Table 4: Average Straight Line Distances (Miles) Between Place of Residence and First Choice Program, by Applicant Performance | |||||
|---|---|---|---|---|---|
| Performance Level of Applicant (Citywide Mathematics Achievement Category) |
Bronx | Brooklyn | Manhattan | Queens | Staten Island |
| Bottom Third | 2.35 | 2.40 | 2.54 | 2.62 | 2.37 |
| Middle Third | 2.51 | 2.44 | 2.65 | 2.60 | 2.37 |
| Top Third | 2.77 | 2.47 | 2.56 | 2.58 | 2.28 |
| SOURCE: IBO analysis of Department of Education data on individual student records | |||||
| New York City Independent Budget Office | |||||
Since the middle of last decade, the city’s Department of Education has implemented a high school assignment mechanism based in important measure on choices of entering high school students. This brief provides information about the interactions between student preferences and high school assignment with respect to the DOE student-to-school matching algorithm. The DOE algorithm is designed to assign as many students as possible into programs that they rank highly, given constraints due to limited seats and the high schools’ own admission priorities. Our analysis suggests that the high school assignment process fulfills this particular task well.
The matching process reflects student preferences to a large extent—these preferences, as stated in students’ lists of high school program ranking, are seen to be correlated with applicants’ “background” characteristics: their individual achievement and the achievement level of their peers. This in turn suggests that, inasmuch as there are large-scale correlations between some background characteristics of students and the characteristics of high schools they end up being assigned to, changing the algorithmic part of the application process will not succeed in eliminating such correlations.
It bears emphasizing that the final assignment of all New York City eighth graders to public high schools is also a function of many different variables that lie well outside the scope of the matching mechanism itself, such as the distribution of students in public middle schools, the preferences of applying students, differences in access to information about high school programs and about navigating the intricacies of the application process, differences in admission methods across high school programs, distribution of seats available in various types of programs, the influence of middle school culture on students’ preferences with respect to high schools, and administrative decisions about placement of students who, for various reasons, could not participate in the process.
The DOE is currently implementing a new plan on middle school choice—initially executed at the community school district level. To the extent this changes middle school peer composition it may have ripple effects on high school choices if peer effects exert a strong influence on high school preferences.
Report prepared by Przemyslaw Nowaczyk and Joydeep Roy
Endnotes
1In many cases an individual high school offers more than one program—for example, in 2012 Gramercy Arts High School offered one program in Fine and Visual Arts, and another program in Performing Arts. Incoming high school students choose individual programs in their applications.
2The procedure currently used by the DOE is a specific instance of a more general matching algorithm called the “two-sided deferred-acceptance matching market.” The designers of this algorithim, the economists Alvin E. Roth and Lloyd S. Shapley, were awarded the Nobel Memorial Prize in Economic Sciences in 2012 for this work.
3For full details of the process, see the following two papers written by its designers: Abdulkadiroglu, A., Pathak, P. A., and A. E. Roth (2005). “The New York City High School Match,” American Economic Review, 95(2): 364-367, and Abdulkadiroglu, A., Pathak, P. A., and A. E. Roth (2009). “Strategy-proofness versus Efficiency in Matching with Indifferences: Redesigning the NYC High School Match,” American Economic Review, 99(5): 1954-1978. The first of these papers is completely nontechnical while the second one is highly technical.
4For details on the old system as well as the new one, see Atila Abdulkadiroglu, Nikhil Agarwal and Parag A. Pathak, “The Welfare Effects of Coordinated Assignment: Evidence from the NYC HS Match,” NBER Working Paper 21046, March 2015.
5For additional details on both the application process (including its timeline) as well as the high school programs offered, see the DOE high school applications website at http://schools.nyc.gov/ChoicesEnrollment/High/default.htm. Also see Nathanson, L., Corcoran, S. P., and C. Baker-Smith (2013), “High School Choice in New York City: A Report on the School Choices and Placements of Low-Achieving Students,” Research Alliance for New York City Schools.
6IBO does not possess key individual data with respect to these students, which prohibits meaningful comparisons of their preferences and results with those of applicants from DOE schools.
7The remaining 0.5 percent of applicants are classified in this report as “Other.” This differs from DOE’s classification, which is more detailed.
8The categorization here follows that of the DOE.
9Because of the fact that many students in New York City public schools are nonnative speakers of English—as noted above, 40 percent of the students in the sample were of Hispanic origin and another 16 percent were of Asian origin—this brief uses mathematics scores, rather than English Language Arts scores, to classify students by performance.
10See http://schools.nyc.gov/Accountability/data/GraduationDropoutReports/default.htm. The graduation rate mentioned here is the one measured at the six year horizon.
11Certain metrics, particularly those related to student performance, are only available at the overall high school level, and not for the individual programs that are housed within it. These measures include high school graduation rates and DOE Progress Report scores. Though students state their preferences in terms of individual high school programs and not the high schools themselves, this brief considers—by necessity—a student’s application to a program as equivalent to choosing the high school the program is situated in.
12Given how DOE uses individual scaled scored to calculate average proficiency ratings, those average ratings can theoretically vary between 1.0 and 4.5. In practice, their range is 1.96 to 4.1.
13Note that overall, a considerable amount of information on individual New York City public high schools was available during this time, particularly on enrollment, course offerings and student performance. But this information was spread out over multiple sources, including the New York City High School Directory and progress report cards.
14When we compared the average graduation rates of all high schools that were applied to by students in a given middle school against the average Mathematics proficiency level of those middle schools (as reported in the DOE school Progress Reports, the associated R-squared of the regression was 0.53.
15This finding is not an artifact of how middle school quality and the preferences of students towards more selective (higher quality) high school programs are measured.
16See Subramanian, Sarita, Joydeep Roy, Stephanie Kranes and Diana Zamora (2016), Advanced Courses & Regents Exams in Middle School: Demographics of the Students Who Take Them & Their Schools, New York City Independent Budget Office, March 2016.
PDF version available here.