THE CITY OF NEW YORK INDEPENDENT BUDGET OFFICE 110 WILLIAM STREET, 14TH FLOOR NEW YORK, NY 10038 Home Base for Mets and Yankees Fans
September 28, 1998
THE CITY OF NEW YORK INDEPENDENT BUDGET OFFICE 110 WILLIAM STREET, 14TH FLOOR NEW YORK, NY 10038 Home Base for Mets and Yankees Fans
September 28, 1998
|
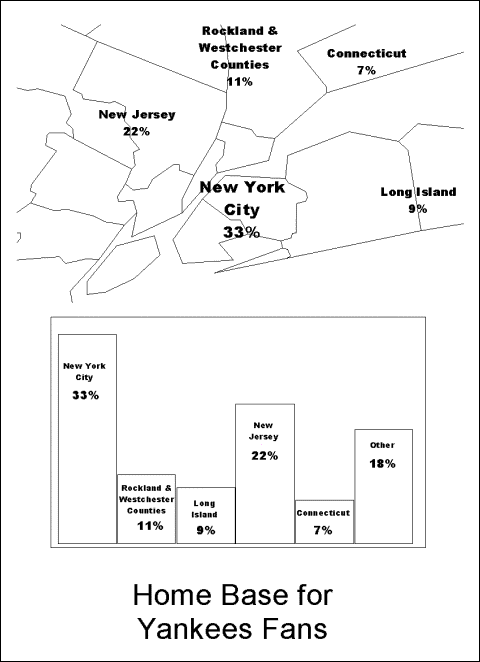
In April 1998, the Independent Budget Office (IBO) published a study on the economic and budgetary impact the city's two Major League Baseball teams have on New York City. The report, Double Play: The Economics and Financing of Stadiums for the Yankees and Mets, continues to be relevant because the city government is still renegotiating leases with the teams and is considering the use of public dollars to construct or renovate the stadiums in which they play. One of the study's findings suggests that heavy use of city funds for stadium construction would raise issues of fairness, since city taxpayers would subsidize the stadiums but relatively wealthier fans from the suburbs would share in the benefit. Unfortunately, at the time we were preparing the report, no reliable data existed to determine the place of residence of fans attending games at Yankee and Shea stadiums. The only way to get such information was to go to the stadiums and ask the fans in attendance where they live.
Accordingly, during the course of the 1998 baseball season, IBO did just that. We attended games at each stadium and asked about 1,000 attendees at each game for their zip codes. Next, we analyzed the data and mapped the results. Our findings are presented below.
Why Does It Matter Where Fans Live? The principal beneficiaries of stadium subsidies are the teams; in recent years, new stadiums have dramatically increased their revenues. In addition, fans who go to games benefit from new and improved facilities. Other metropolitan area fans of the teams, who do not necessarily attend games, also benefit from the presence of the teams in the region and from new stadiums insofar as they are necessary to retain the teams. As a result, it would be inequitable for subsidies to build or renovate ballparks for the Mets and Yankees to come entirely from residents of New York City. At present, because debt service at the existing stadiums is quite small, it does not take all that much suburban fan spending in and around the stadium¾and resulting tax collections¾to make baseball games a net fiscal gainer for the city. Heavy city subsidization of a new stadium, however, could easily turn any surplus into a deficit. Double Play found that the presence of the Yankees and the Mets in the city generated $7.6 million and $5.3 million in city taxes and fees in 1996. We estimate 67 percent of Yankees fans live outside the city. This suggests Yankees game-day "tourists" brought in $5.1 million (67 percent of $7.6 million) to the city's treasury. The annual take at Shea is about $3.2 million from the 61 percent of Mets fans who are non-city residents. Because new stadiums are expected to increase attendance and stadium revenue, the annual take from non-city residents should increase to $7.1 million for the Yankees and $4.4 million for the Mets. The cost of new or substantially renovated stadiums, however, is likely to exceed those revenue amounts. A 1996 study of four potential sites for a new stadium for the Yankees showed cost estimates ranging from $700 million to over $1 billion. The estimated cost of a proposed replacement for Shea was $500 million. If the city's contribution to each new stadium were, say, $300 million, the annual cost of such a capital outlay would come to $22 million per stadium, leaving a substantial net cost to city taxpayers. One justification for spending public dollars on stadium construction is the value of the stadiums to the teams' fans. New stadiums constructed elsewhere in the U.S. during the 1990s have yielded sharp, sustained increases in attendance, proving they are popular attractions. But in the case of the Yankees and Mets, the majority of fans benefiting will not be city residents. In New York, as in many American cities, suburban residents tend to have greater incomes. The city may be underrepresented among stadium attendees because the fans who go to games might come from wealthier households-- who are more likely to live in the suburbs. New stadium designs which frequently emphasize luxury seating options and upscale dining target higher income households, potentially leading to even fewer city residents attending games. The relevance of income to our analysis stems from a concern for fairness. After the team, the attending fans benefit the most from a stadium subsidy. That is a concern if the fans are non-city residents and the stadium is built using city taxpayers' dollars. If these fans are also relatively wealthy members of our metropolitan area, a stadium subsidy represents a transfer from relatively low-income to relatively high-income households as well as from city residents to suburban residents. In order to address this potential inequity, it would make sense for any public subsidies to come from a broader region. Examples of statewide and metropolitan area financing include Camden Yards in Maryland, financed through a statewide sports lottery, and Coors Field in Colorado, funded by a multi-county tax increase. One way to ensure the stadium's cost is divided between the team and the appropriate fan base would be for the city to raise revenues from additional taxes on ticket sales, concessions, or payments from television contracts.
Survey Results
Census data on average household income by zip code corroborates the supposition that members of higher income households are more likely to attend baseball games. (See Table 2.) This tendency is borne out by a comparison of the average household income for the city and the average household income in the fans' home zip codes. The weighted average 1990 household income in the zip codes reported by Yankees fans was $58,627-nearly 40 percent higher than the city resident average of $41,882. Yankees fans from the five boroughs reported zip codes with an average household income of $48,955 about 17 percent higher than the average for all city residents while Yankees fans from outside the city came from zip codes where the average was $63,662 nearly 52 percent higher. For fans visiting from the tri-state metropolitan area, the weighted zip code average income was $67,783-about 62 percent higher than the city resident household average, and indeed almost 18 percent higher than the suburban household average. The zip code average for fans visiting from the rest of the U.S. was $56,630. Survey Methodology IBO surveyed fans at four games with the goal of asking 1,000 fans per game for their home zip codes. The number 1,000 was selected because proportions drawn from an arbitrary sample of that size have a 95 percent probability of being within 3 percentage points of the true proportions. In fact, we obtained zip codes or alternative usable geographic information (for example, Brooklyn, Texas, or France) from 701 and 1,141 for two Mets games, and 925 and 1,101 for two Yankees games. In the case of the game at which 701 fans volunteered information, our estimate has a 95 percent chance of being within 3.6 percentage points of the true ratio if our sample was drawn randomly from all fans. The other games produced more precise estimates. Five IBO surveyors fanned out at each game and polled fans as they entered the various stadium gates. In order to prevent having our data overly affected by lumps of fans from one location, surveyors intentionally skipped many individuals passing through the turnstiles. Similarly, when large groups reported coming from a single zip code, their number was divided by five. Some additional polling was conducted within the stadiums. The two Yankees games surveyed were a weekend game and a weeknight game. Based on the Yankees home schedule, which has 51 weeknight and Friday night games and 30 weekend and weekday games, a weighted average of our two game day estimates was computed (the weekend game had 70% of fans from outside the city, the weeknight game 65%). For the Mets, the games surveyed were a weeknight game and a weekday day game. This latter game was treated as a weekend game and a weighted average was computed based on the Mets' home schedule.

|