
October 2012
Tracking the High School Class of
2009:
How Many Passed the Regents
Test and Were Deemed College Ready?
PDF version available here.
Summary
New York’s Regents tests —statewide tests in various subject areas developed by the New York State Education Department under the direction of the state’s Board of Regents—have become an increasingly critical marker of student achievement. Most students must now pass five of these tests to graduate from public high school, and the state bases its definition of college readiness on students achieving scores higher than those required to just pass the math and English exams.
Using data from the city’s high school class of 2009, this report uses each student’s Regents exam results to track their progress towards graduation. In addition, the report looks at the class of 2009 Regents scores to determine how many students met the state definition of college ready. Among our findings:
- Students who graduated in four years—by September 2009—tended to make steady progress towards meeting the Regents requirements. After the second year of high school, more than half of the students who would graduate on time with Regents diplomas had met most of their requirements. After the third year, more than half had met all the requirements.
- Unlike graduates, the typical student who did not graduate made little progress in meeting the Regents requirements, no matter how long they were enrolled. On average, students who dropped out or received a GED diploma scored a passing grade on less than one required Regents exam.
- Less than one-third of New York City’s class of 2009 graduates met the state’s definition of college ready in both math and English based on their Regents scores. Only about half the graduates who were college ready in English were also college ready in math.
IBO also considered the frequency at which students scored a 65, the passing grade, on Regents exams. More than 1 in 5 Regents diploma recipients in the class of 2009 scored exactly 65 on one of the exams. Scores of 65 were common among all students in all subjects, especially students who took the exams late in their high school careers. The city’s Department of Education has begun to change how the exams are graded, which it expects will reduce the number of students who score exactly 65.
This report is our second to look closely at the class of 2009. In September, IBO released a report examining four-year outcomes, demographics, and discharges for this same group of students.
Introduction
The rate at which students graduate from high school is a widely accepted barometer of success for schools and school systems, and a high school diploma is an important credential for students hoping to attend college or enter the workforce. Recently, educators and researchers have also focused on the extent to which high schools prepare their graduates for college and careers. Students throughout New York State must pass five Regents exams—statewide tests in various subject areas developed by New York State Education Department under direction of the state’s Board of Regents—to receive a traditional Regents diploma. New York State’s definition of college readiness requires meeting a threshold higher than the general passing score in math and English. This study uses the achievement results from these tests to track the progress of both graduates and nongraduates who entered high school as members of New York City’s class of 2009. The study also explores the extent to which graduates from New York City Department of Education (DOE) schools meet the state definition of college ready, and whether they are barely meeting the requirements for a either a local or Regents high school diploma.
All statistics presented in this report reference the graduation requirements that were in place in June 2009, when this group of students was eligible for graduation. Subsequent graduation cohorts were required to meet more stringent criteria, as the state phased out the local diploma as an option for students. Tests taken by the class of 2009 were typically scored by teachers at their schools, and state regulations at the time required that open-ended sections of math and science tests with scores just below the passing threshold be rescored for accuracy. In 2011, amid concern that the rescoring process was potentially encouraging friendly "home-team" scoring, state education officials prohibited the rescoring of any exams. An additional DOE policy change mandates that by 2013 no teacher grade their own students’ exams. An sppendix to this report examines Regents scores from 2009-2010 and 2010-2011, and provides further detail on changes in scoring policies.
The report begins by identifying the students who make up the class of 2009. It then documents overall progress towards the Regents requirements and progress by subject for all students in the cohort. A third section examines variation in achievement among graduates by examining the distributions of Regents scores by year and subject, and by comparing the share of students who met college ready standards with the share of students who barely met the graduation requirements. A final section documents variation among city high schools in the share of graduates who were college ready, and the share who barely met the requirements for a Regents diploma.
Background on the Data and Analysis
This study is based on data from all students who were ever part of the general education high school class of 2009 in New York City public schools. IBO constructed the data by analyzing the movements of individual students within the school system. A companion report, examining graduation outcomes in New York City using the same group of students, provides details on the demographic composition of the high school class and the flow of students in and out of the school system.
The class of 2009 cohort is composed of all students entering high school as general education noncharter school students for the first time as 9th graders in the 2005-2006 school year, 10th graders in 2006-2007, 11th graders in 2007-2008, or 12th graders in 2008-2009. Students who spent time at charter schools or in special education status were included, but only if they also met the first time general education, noncharter enrollment criteria in one of these grades and years. Students who had transferred to a charter school by the end of the period were counted as discharges. Those who had moved from general education public high schools into District 75 special education programs by the end of the study period were excluded from the cohort, as were those who moved into District 79 General Education Development (GED) programs directly from special education. The cohort includes all students enrolled for at least one day; students who were discharged on the same day they enrolled were ignored. Students in a five-year program at Aviation High School were included only if they were expected to graduate in 2009.
All students in the cohort were tracked from September 2005 through August 2009 and classified as graduates, dropouts, discharges, GED recipients, or still enrolled based on their status as of September 9, 2009. Students receiving a local, Regents, or Advanced Regents diploma were classified as graduates, as were a small number who completed an Individualized Education Program (IEP). Discharged students are those who left the school system for various reasons without graduating or dropping out, such as those transferring to a school outside of the city.
Regents test results were analyzed for each student in the cohort. Passing the Regents exams in five subjects is required for graduation: English, math, science, global history, and U.S. history. Currently, students can receive a Regents diploma by passing the five required tests with a score of 65. An Advanced Regents diploma requires passing eight or more tests with a score of 65. The class of 2009 could also receive a local diploma, which has since been phased out and is no longer available, by passing three of five tests with a 55 and two of five with a 65. About half the graduates from the class of 2009 received standard Regents diplomas, with about 25 percent receiving Advanced Regents diplomas and the other 25 percent receiving a local diploma. This study focuses primarily on the requirements for a standard Regents diploma—passing tests in all five subjects with a score of at least 65. Students may retake failed Regents exams and often take multiple tests in the same subject. Unless otherwise specified, all reported test scores represent the highest score obtained by each student in each subject.
For students in the class of 2009, state Regents guidelines indicated that math and science exams receiving scores of 60-64 should be rescored to ensure accuracy. Starting in 2011, DOE instituted a new state-mandated policy against rescoring any exams. In 2012, DOE began a pilot program of "distributed scoring" to comply with state regulations prohibiting teachers from scoring their own students’ tests by 2013. The DOE believes these changes will reduce the disproportionate share of students scoring exactly at the passing cutoff of 65, a phenomenon that has been well documented systemwide by both academic researchers and the press. This study adds to previous analyses of Regents scores at the passing threshold by examining how the clustering of scores around 65 affects students throughout their high school careers and documenting the proportion of graduates who were one point away from either not graduating or having to retake exams.
Tracking Progress on the Regents Exams
IBO tracked progress towards meeting the Regents requirements over time and by subject for all students in the class of 2009. In general, eventual graduates showed steady progress towards meeting the requirements while the typical nongraduate was not close to meeting the requirements after four years.
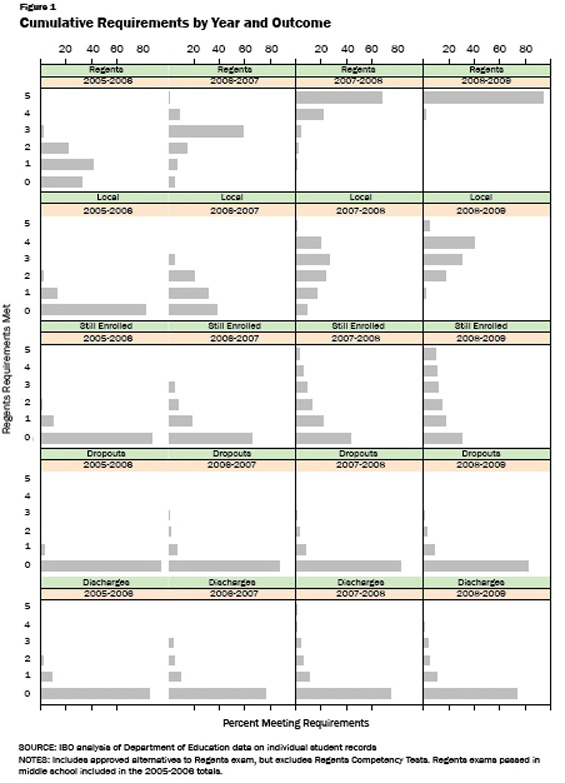
Although there is a general sequence in which students first attempt each required Regents exam, the tests can be taken throughout high school and there is a good deal of variation among students. Global history is most commonly first attempted in the second year of high school, with U.S. history in the third year, but it is not uncommon for students to pass math or science exams in their first year or during middle school. To measure progress towards the Regents requirements, IBO constructed a scale that represents a count of the subject area requirements met by passing an exam with a score of at least 65. This differs from a simple sum of Regents exams passed. For example, a student who scored at least 65 on two math exams and nothing else would be counted as meeting one Regents requirement rather than two. Approved alternatives to the Regents tests, such as portfolios, were included, but Regents Competency Tests designed for special education students were not.1 The number of Regents requirements met was averaged by year and graduation outcome. Students who never attempted Regents exams were counted as meeting none of the requirements, and Regents exams passed with a score of 65 or more prior to high school were counted in the 2005-2006 totals. Table 1 shows a summary of progress towards the Regents requirements on a scale of 0 to 5, by four-year high school outcome.
|
Table 1
Progress
Towards Regents by Four-Year Outcome |
|||||
|
Mean Regents Requirements Met, 0-5 |
|||||
|
2005-2006 |
2006-2007 |
2007-2008 |
2008-2009 |
Mean Days Enrolled |
|
|
Graduates |
|
|
|
|
|
|
Regents |
0.96 |
2.65 |
4.50 |
4.90 |
645 |
|
Local |
0.20 |
0.96 |
2.36 |
3.22 |
624 |
|
Dropouts |
0.06 |
0.20 |
0.31 |
0.32 |
419 |
|
Discharges |
0.18 |
0.40 |
0.51 |
0.53 |
207 |
|
Still Enrolled |
0.14 |
0.55 |
1.21 |
1.86 |
616 |
|
GED |
0.23 |
0.57 |
0.84 |
0.88 |
497 |
|
SOURCE: IBO analysis of Department of Education data on
individual student records
NOTES: Includes approved alternatives to Regents exam, but
excludes Regents Competency Tests. Regents exams passed in
middle school included in the 2005-2006 totals. |
|||||
For students who graduated with a Regents diploma, progress towards the requirements often started in their first year of high school, with most progress occurring in years two and three. The average student receiving a traditional or advanced Regents diploma had completed more than four of the five requirements by the end of the third year. By the end of the fourth year, almost all had met all five requirements.2 Local diploma recipients—needing scores of 65 or more on at least two tests with scores of 55 or more on the others—progressed more slowly, but made steady progress. Progress was slower in the fourth year, and the average local diploma recipient had met more than three of the requirements with a score of at least 65 by the end of their high school careers, consistent with the fact that the standard for granting the local diploma allowed up to three tests to be passed with a score of 55.
For students who dropped out, are discharged, or receive a GED, progress towards the Regents requirements was slow and accumulation was very minimal during the time they are enrolled in DOE high schools. These students were much less likely than graduates to complete one of the requirements in the first year. The average dropout had not met even one requirement by the time they left the school system, while the average GED recipient had met less than one Regents requirement before completing their GED program. Among discharges, the average student discharged in the third year had met one requirement while those discharged in the fourth year had met an average of just over one requirement. While the average student who was still enrolled after four years showed substantially more progress than dropouts, discharges, and GED students, they had still met less than half of the requirements for a Regents diploma by September 2009.By definition, dropouts and discharged students were not enrolled at DOE schools for the entire four-year period. The average number of days enrolled in the city’s public school system for each type of student is also shown in Table 1. The difference amounts to more than one school year between graduates and dropouts, on average, and more than two school years between graduates and students who were discharged. Discharged students tend to leave the school system earlier in their careers, when students are less likely to take Regents exams, which helps explain the very low number of requirements met for this group. Table 2 shows progress towards meeting the Regents requirements for students who were discharged, among those enrolled each year. Despite the fact many discharged students left early in their high school careers, the average student discharged during the third and fourth year had still barely met one of the requirements.
|
Table 2
Progress Towards Regents Requirements Among
Discharged Students by Year Enrolled,
Mean Regents Requirements Met, 0-5 |
||
|
Mean Requirements Completed |
Number of Students |
|
|
Enrolled in |
|
|
|
2005-2006 |
0.20 |
15,361 |
|
2006-2007 |
0.59 |
10,661 |
|
2007-2008 |
0.99 |
7,023 |
|
2008-2009 |
1.23 |
3,246 |
|
SOURCE: IBO analysis of Department of Education data on
individual student records |
||
Shifting the focus from average progress to a more detailed look at the distribution of Regents requirements met over time confirms that students who eventually graduate tended to get off to a quick start. By the end of the first year, just over two-thirds of the students who eventually graduated with a Regents diploma after four years had met at least one requirement. After the third year more than two-thirds had met all five. By contrast, less than 15 percent of students who were discharged or still enrolled after four years had completed one or more of the requirements by the end of the first year, along with just 5 percent of the students who would eventually drop out. Dropouts showed particularly little progress over the four-year period. By the end of the fourth year, fewer than 1 in 5 had met even one Regents requirement.
Not surprisingly, by year four, students who remained enrolled had made the most progress among the nongraduates. About a third had met three or more requirements, another third met one or two, and the remaining third did not meet any. More than 10 percent of students remaining enrolled after four years had met all five Regents requirements, implying that these students were missing course credits required for graduation.
The timelines for meeting each subject requirement varied widely between the different categories of four-year outcomes. This is illustrated in Table 3, which shows Regents progress by subject. Students who eventually received a Regents diploma began completing science and math requirements in the first year and most completed global history in their second year, and U.S. history and English in their third year. Students still enrolled after four years progressed much more slowly than graduates, and were somewhat more likely to have scored at least a 65 in math and English than in the other three subjects by the end of the fourth year. The share of dropouts and students who were discharged that scored at least 65 on a Regents exam during their time in high school was very low in every subject. About 10 percent of dropouts had completed the math Regents requirement during the four-year period, with less than 10 percent completing each of the other required subjects.
|
Table
3
Progress Towards Graduation
By Subject and Four-Year Outcome |
||||
|
|
Percent Scored 65≤ on at Least 1 Science Regents |
|||
|
|
2005-2006 |
2006-2007 |
2007-2008 |
2008-2009 |
|
Graduates |
|
|
|
|
|
Regents |
61.9 |
83.2 |
92.1 |
97.9 |
|
Local |
12.7 |
26.4 |
37.1 |
52.6 |
|
Dropouts |
4.0 |
6.2 |
7.2 |
7.4 |
|
Discharges |
11.7 |
15.5 |
16.6 |
16.7 |
|
Still Enrolled |
9.6 |
17.9 |
25.2 |
35.2 |
|
|
Percent Scored 65≤ on at Least 1 Math Regents |
|||
|
|
2005-2006 |
2006-2007 |
2007-2008 |
2008-2009 |
|
Graduates |
|
|
|
|
|
Regents |
26.4 |
84.6 |
95.5 |
98.9 |
|
Local |
4.6 |
40.8 |
61.0 |
72.0 |
|
Dropouts |
1.7 |
7.5 |
9.8 |
10.2 |
|
Discharges |
4.9 |
13.8 |
15.8 |
16.1 |
|
Still Enrolled |
3.3 |
20.4 |
35.0 |
45.6 |
|
Percent Scored 65≤ on at
Least 1 US History Regents |
||||
|
|
2005-2006 |
2006-2007 |
2007-2008 |
2008-2009 |
|
Graduates |
|
|
|
|
|
Regents |
4.9 |
8.8 |
79.4 |
97.4 |
|
Local |
1.4 |
3.7 |
46.0 |
67.7 |
|
Dropouts |
0.3 |
0.8 |
2.5 |
3.0 |
|
Discharges |
1.0 |
1.5 |
4.1 |
4.4 |
|
Still Enrolled |
0.8 |
1.7 |
15.1 |
30.5 |
|
Percent Scored 65≤
on at
Least 1 Global History Regents |
||||
|
|
2005-2006 |
2006-2007 |
2007-2008 |
2008-2009 |
|
Graduates |
|
|
|
|
|
Regents |
2.1 |
74.5 |
89.8 |
96.5 |
|
Local |
0.6 |
18.2 |
31.6 |
46.5 |
|
Dropouts |
0.3 |
4.2 |
6.0 |
6.1 |
|
Discharges |
0.3 |
7.4 |
9.0 |
9.1 |
|
Still Enrolled |
0.3 |
12.8 |
21.9 |
31.9 |
|
|
Percent Scored 65≤ on at Least 1 English Regents |
|||
|
|
2005-2006 |
2006-2007 |
2007-2008 |
2008-2009 |
|
Graduates |
|
|
|
|
|
Regents |
0.5 |
13.8 |
93.6 |
99.8 |
|
Local |
0.4 |
6.7 |
60.0 |
82.7 |
|
Dropouts |
0.1 |
0.9 |
5.3 |
5.7 |
|
Discharges |
0.1 |
1.7 |
5.8 |
6.1 |
|
Still Enrolled |
0.1 |
2.4 |
24.3 |
43.1 |
|
SOURCE: IBO analysis of Department of Education data on
individual student records
NOTES: Includes approved alternatives to Regents exam, but
excludes Regents Competency Tests. Regents exams passed in
middle school included in the 2005-2006 totals. |
||||
A Closer Look at High- and Low-Performing Graduates
The high school graduation rate is an important and widely reported measure of a school system’s success, and a previous IBO report provided a detailed analysis of the city’s graduation rate for the class of 2009. Distinguishing between the Regents performance of graduates and nongraduates illustrates that nongraduates were typically not close to completing the Regents requirements. However, examining Regents scores among graduates also shows a wide range of achievement. With students taking different tests at different times in order to meet the requirements in each of the five subjects there is no simple way to summarize the distribution of student achievement on a single scale. Instead, this report examines the very different achievement levels of two groups of graduates: Those who are deemed college ready by state standards, and those who were just one point away from either not graduating or having to retake exams.
To identify relatively high-achieving students, IBO focused on those who are college ready based on their Regents exam scores. A major study commissioned by New York State demonstrated that students who score less than 75 on the English Regents and less than an 80 on the math Regents are unlikely to earn a grade of C or better in college-level courses in those subjects. The state education department has used these as thresholds for identifying college ready students, and the DOE has begun to incorporate test results based on these cutoff scores into performance grades for individual schools. Using New York State’s thresholds for college readiness as a measure of relatively high achievement, less than one third of all graduates from the class of 2009 were college ready in both math and English. Graduates were more likely to be college ready in English than in math. Only about half the nearly 29,000 students who were college ready in English were also college ready in math.
As a measure of low achievement on the Regents exams, we identify students who were just one point away from not meeting the Regents requirements—students who scored exactly at the passing cutoff of 65 in at least one of the required exams. Those scoring exactly 65 on a required exam make up just below 22 percent of all Regents graduates, about 10 percentage points lower than the proportion who were college ready in both math and English.3 While these groups are not mutually exclusive by definition, in practice they make up distinct groups of students. Just 4 percent of students who were college ready in math and English received a score of exactly 65 on one of the other exams. Similar to figures for Regents diploma recipients, nearly 23 percent of local diploma recipients scored exactly 55 on one of the required exams. A total of 10,277 graduates from the class of 2009—more than 1 in 5—would have either failed to receive their diploma or been required to retake exams had they scored one point lower on one exam.
|
Table 4
High- and Low-
Achieving Graduates
College Ready
vs High Score Exactly 65 |
||
|
|
Percent |
Number |
|
All Regents and
Local Recipients |
|
47,281 |
|
College Ready |
|
|
|
College Ready in Math,
But Not in English |
5.40% |
2,570 |
|
College Ready in English,
But Not in Math |
30.10% |
14,244 |
|
College Ready in Both Math and English |
31.2% |
14,752 |
|
High Score
Exactly 65 or 55 in at Least One Required Subject |
|
|
|
Regents Diploma Recipients |
|
35,363 |
|
High Score Exactly 65 in at Least One |
21.5% |
7,601 |
|
Local Diploma Recipients |
|
11,918 |
|
High Score Exactly 55 in at Least One |
22.5% |
2,676 |
|
SOURCE: IBO analysis of Department of Education data on
individual student records |
||
The clustering in the distribution of the highest math and English scores for graduates around the passing thresholds is shown in Figure 2. Red lines identify the Regents passing cutoff of 65, with blue lines identifying the college ready thresholds of 75 and 80 in English and math, respectively. The distribution of English scores shows a spike at 65, while scores of 64 were rare. Consistent with the fact that 61 percent of graduates were considered college ready in English, many of the scores were clustered above the college ready threshold of 75.3 In math, where just 37 percent of graduates were college ready, a high score of exactly 65 was by far the most common. A small number of graduates received scores between 55 and 65 in English and math, representing those who received local diplomas.
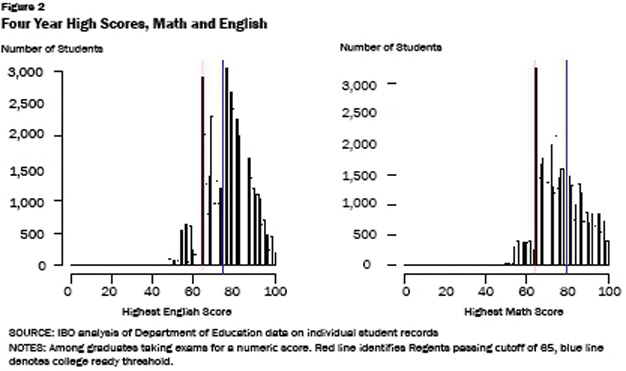
Figure 3 shows the distribution of English and math scores among graduates for each year of high school. On both exams, the share of college ready graduates and those who barely received their diploma varied by year. In English, the share of graduates meeting the college ready standard was highest in school year 2007-2008, the most common year the English exam was taken. In math, higher scores were more common for students taking the exams in early years, with the share of students receiving a college ready score declining each year. In both math and English, the share of students scoring exactly 65 in the final year was high, with very few students receiving a college ready score. Just over 8 percent of Regents or local graduates taking a math test in the fourth year received a high score of exactly 65 compared with just below 9 percent receiving a college ready score.
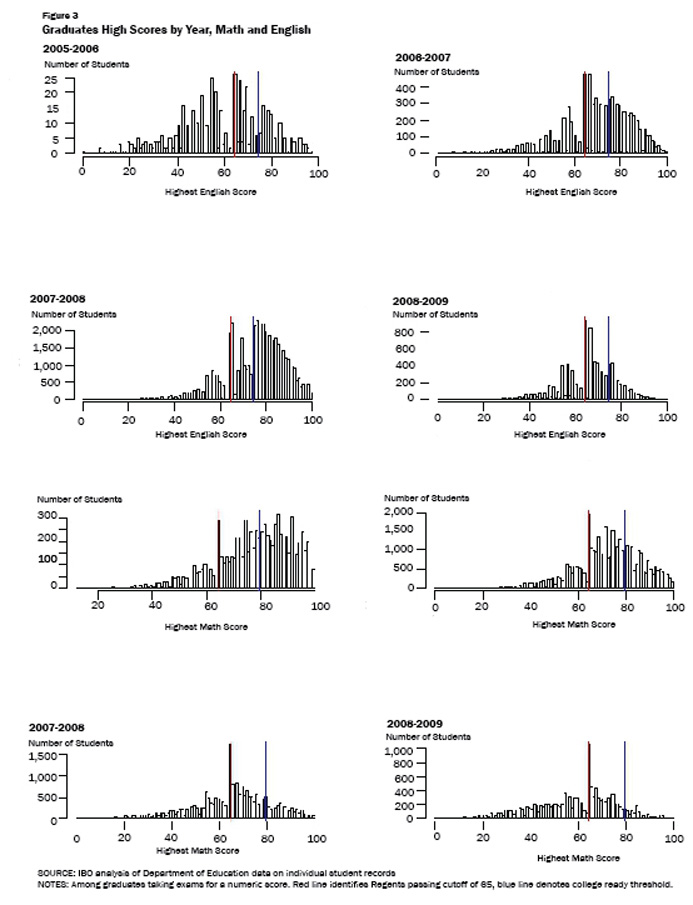
For graduates, math and English scores exactly at the Regents passing cutoff of 65 became more common in later years. Exploring this phenomenon in greater detail, Table 5 shows the percentage of all students (including nongraduates) receiving a score of exactly 65 in each subject by year. In every subject, students taking the exam in the fourth year were more likely to score exactly 65 than students taking the exam in any other year. In most cases, the share of students scoring exactly at the passing cutoff gradually increased over the years. In English, 1 in every 10 students taking the exam in the fourth year received a score of exactly 65.
|
Table 5
Percent Scoring Exactly
65, By Year and Subject |
||||
|
2005-2006 |
2006-2007 |
2007-2008 |
2008-2009 |
|
|
Science |
6.1 |
7.8 |
7.1 |
9.5 |
|
Math |
3.8 |
5.4 |
7.3 |
8.3 |
|
US History |
5.9 |
5.9 |
4.1 |
7.2 |
|
Global History |
5.2 |
5.4 |
6.6 |
9.1 |
|
English |
4.9 |
5.5 |
5.1 |
10.0 |
|
SOURCE: Source: IBO analysis of Department of Education data
on individual student records
NOTES: Among all students taking exams for a numeric score. |
||||
College Readiness and Scores of Exactly 65 by School
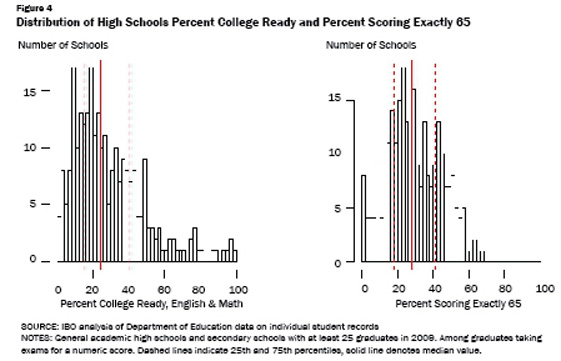
High schools varied substantially both in the percent of graduates who were college ready and the percent scoring exactly 65, just as high schools also vary in their selectivity and the kinds of students they enroll. Stuyvesant, Staten Island Technical, and Townsend Harris high schools each had less than 1 percent of their Regents graduates scoring exactly 65 with almost 100 percent being college ready in math and English. Figure 4 shows the distributions of the share of students with college ready scores and the share of students with at least one score of exactly 65 on one of the required exams, for the 265 general academic high schools and secondary schools with at least 25 Regents graduates in the class of 2009.Dashed lines denote the 25th and 75th percentile, with the solid line representing the median. Half of these high schools produced a 2009 graduating class in which more than 24 percent of Regents diploma recipients were college ready in both math and English. Only 13 high schools—about 5 percent of the total—had more than three-quarters of their Regents graduates college ready in both math and English. Turning to students who barely graduated, in half of the 265 high schools at least 28 percent of their Regents graduates received a score of exactly 65 on at least one of the required tests. At 28 of these schools, half or more of the graduates scored exactly 65.
Tracking the Regents exam results for the class of 2009 reveals both the divergent paths of graduates and nongraduates, and the extent to which graduates leave high school prepared for college and careers. While eventual graduates tended to begin meeting Regents requirements early in their high school careers and progressed at a steady pace, progress towards the degree requirements was slow and minimal for eventual nongraduates. The typical student who had not graduated after four years was not close to meeting the requirements. About 30 percent of students graduating from New York’s high schools in 2009 were college ready in both math and English, while more than 1 in 5 barely graduated by earning the lowest passing score on at least one of the required exams.
This report prepared by Asa Wilks
APPENDIX: Scores of 65 Over Time
During the time period covered by this study, state regulations required that open-ended response sections of math and science Regents exams with scores of 60-64 should be rescored to ensure accuracy, and exams were typically scored in the school in which they were administered. The DOE began to implement changes to Regents exam scoring procedures during the 2010-2011 school year. As mandated by new state regulations, no sections of any exams were to be rescored as of 2010-2011. Also in 2010-2011, the city began using automated scanners to score multiple choice sections of the exams. In October 2011, the New York State Board of Regents mandated that no teacher may score their own students’ exams. The DOE began phasing in this policy change in January 2012, and plans to have the new "distributed scoring" model—prohibiting any school from grading its own exams—fully in place by January 2013. These changes are expected to reduce the number of exams receiving a score of exactly 65.
IBO took a preliminary look at the prevalence of scores at the passing cutoff in the years since 2009. Because we have not assembled cohorts for the class of 2010 or the class of 2011, this analysis looks at all students who took Regents exams in the 2009-2010 and 2010-2011 school years. Data for Regents exams taken in the 2011-2012 school year are not yet available. Table 1A shows the percent of students taking Regents exams in math, English, and science for a numerical grade who received a high score of 65 in each year.4 For math and science tests, the share of students scoring exactly 65 increased slightly in 2009-2010; on English tests that year, the share decreased very slightly. The prevalence of scores at the passing cutoff then decreased by about 2 percentage points in 2010-2011—the year new scoring procedures began to be phased in—in all three subjects, suggesting the policy changes pushed down the share of students receiving scores of exactly 65.
Because students take Regents exams during all four years of high school, the share of any given high school class that graduated with scores at the passing cutoff depends on the policies that were in place throughout their high school careers. If policy changes taking effect between 2010-2011 and 2012-2013 affect the number of students scoring just at the passing threshold, as appears to be the case, we would expect the greatest impact for the graduating class four years after the change.
|
Table 1A
Percent of All Students
Taking Tests for a Numeric Score |
|||
|
|
High Score Exactly 65 |
||
|
2008-2009 |
2009-2010 |
2010-2011 |
|
|
English |
6.5% |
6.4% |
4.4% |
|
Math |
6.7% |
7.0% |
4.8% |
|
Science |
7.3% |
7.7% |
4.4% |
|
SOURCE: IBO analysis of Department of Education data on
individual student records
NOTE: Among all test takers from all high school cohorts,
taking exams for a numeric score. |
|||
Endnotes
1Portfolios are described by DOE as "alternative assessments that allow students to showcase their work in a particular subject area selected according to an approved rubric, in lieu of taking the Regents exam. A limited number of schools have been authorized by the State to conduct Regents portfolio assessments." Portfolios were included in the IBO analysis because they can fulfill a requirement for a standard Regents diploma. Regents Competency Tests (RCTs), mostly designed for special education students, are currently available only to students who entered high school before 2010-2011. RCTs were not included because, unlike approved Regents alternatives, they cannot lead to a standard Regents diploma. Among the class of 2009, 4,529 of 89,750 students took at least one RCT during high school.
2Just fewer than 5 percent of Regents and Advanced Regents diploma recipients had no record of passing at least 1 of the 5 required tests, including approved alternatives or official waivers. The DOE believes this reflects the fact that documenting exam scores in the data reporting system was not required at the time, and their list of state approved alternatives may not be exhaustive. An internal DOE audit contacted schools in some cases where students appeared to be lacking records of passed exams. While schools were in most cases able to provide documentation of passed exams, the audit also found that some graduates did not have records of passing all five tests.
3Because college ready thresholds were established to reflect the relationship between Regents scores and future college performance, the specific thresholds may themselves have been influenced by the distribution of scores.
4A small share of test records do not indicate numerical grades, including some approved Regents alternatives and cases where requirements are waived due to completion in other school districts.